


- I. Introduction
- A. Intellectual Property Indicators
- 1. From “How Many?” to “How Good?”—Early Patent Indicators
- 2. Quantity-Based Indicators and the Quest for Comparability
- 3. Quality-Proximate Indicators: Citations, Families, and Renewals
- 4. Economic-Value Indicators
- 5. Enforcement and Institutional-Performance Metrics
- 6. Knowledge-Diffusion and Network Indicators
- A. Intellectual Property Indicators
- II. WIPO and Patent Indicators
- III. Network Science and Importance as a Patent Indicator
- IV. Methods
- V. Results
- VI. Discussion of Patent Trends
- VII. Conclusion
I. Introduction[1]
A. Intellectual Property Indicators
Indicators of intellectual property (IP)—metrics proxying underlying legal, technological, or economic phenomena—have become indispensable to scholars who wish to trace the contours of innovation, competition, and value creation in modern economies.[2] Available data from the World Intellectual Property Organization (WIPO), incorporating more than three million patent applications, underscores the sheer volume of available data.[3] Yet quantity is only a starting point, as patent indicators have moved steadily from simple counts toward increasingly sophisticated, multi-dimensional measures that seek to capture quality, economic worth, knowledge diffusion, and institutional performance.[4] In recent years, the World Intellectual Property Indicators report (WIPI), compiled and published by WIPO, has painted a vivid picture of a dawning age of Chinese patent hegemony.[5] However, using numbers of patents and patent applications to compare countries and patent authorities can be quite inaccurate. Alternative indicators, such as the “importance” or “influence” of patents, offer more rigorous and accurate methods for measuring patents.[6]
1. From “How Many?” to “How Good?”—Early Patent Indicators
Zvi Griliches’s celebrated survey first codified raw patent counts as economic indicators of inventive effort but acknowledged various issues that arise when interpreting patent data, such as difficulties distinguishing “noise” present in patent data.[7] While acknowledging that patents are a uniquely valuable source of information, any single measure of data must be used with care and considerable supplemental information. The Organization for Economic Cooperation and Development (OECD) attempted to distill cautions about simply counting up patents into its Patent Statistics Manual, establishing best practices for constructing internationally comparable patent indicators and highlighting sources of bias such as “home advantage” and sectoral propensities to patent.[8] This literature makes clear that even the most ubiquitous patent indicator is theory-laden: it rests on assumptions about the relationship between legal acts (e.g., filing, grant, renewal) and the underlying phenomena researchers hope to observe (e.g., inventive output, technological rivalry, or rent appropriation).[9]
2. Quantity-Based Indicators and the Quest for Comparability
Straightforward tallies still serve many macro-level purposes. Yet because national patent offices differ in size, scope, and fees, scholars often rely on “triadic” families—patent applications filed for the same invention at the U.S. Patent and Trademark Office (USPTO), the European Patent Office (EPO), and the Japan Patent Office (JPO)—as a higher-value subset that mitigates jurisdiction-specific idiosyncrasies.[10] Related approaches count Patent Cooperation Treaty (PCT) applications or priority filings to approximate the earliest legal manifestation of an invention.[11] These indicators remain attractive for cross-country comparisons but still embed assumptions, for instance, that “triad” protection is universally valuable or that PCT procedures are uniformly exploited, which may not hold true for small firms or developing-country actors.[12]
3. Quality-Proximate Indicators: Citations, Families, and Renewals
Recognizing that not all patent rights are created equal, researchers have sought measurable correlates of private or social value. Forward citation counts emerged: Highly cited patents tend, on average, to be more technologically influential and valuable in financial markets.[13] Citation-based indicators have since been refined to weight citations by citing-patent quality, adjust for technology-specific citation propensities, or combine with family size and claim length to form composite “quality indices.”[14] Nevertheless, citations can be manipulated, are available only with a lag, and may reflect examination practices as much as technological impact.[15] Fortunately, better uses of patent citations have been developed.
Maintenance-fee data adds a temporal dimension: Patents that are renewed to full term signal that owners perceive continuing value, whereas early lapses suggest low private returns.[16] Because renewal rules differ across jurisdictions, comparative research often standardizes by computing renewal-based value distributions within each office before aggregating.[17]
4. Economic-Value Indicators
Moving beyond proxies, some indicators exploit direct or quasi-market signals. News of highly cited patent grants can raise a firm’s market capitalization, suggesting that forward citations capture information valued by investors.[18] Licensing revenue, securitization of royalty streams, and collateralization of patents in venture-loan agreements likewise provide observable price data, but are often proprietary or incomplete.[19] Litigation outcomes offer another illuminating window: Damages awards, settlement amounts, or the grant of permanent injunctions after eBay v. MercExchange correlate with forward citations and family size, implying that courts rely (perhaps implicitly) on similar quality cues.[20] Yet indicators based on litigation skew toward contentious or commercially significant rights, and, thus, risk overstating average patent value.[21]
5. Enforcement and Institutional-Performance Metrics
Legal-system features themselves have become objects of measurement. Post-grant opposition, post-grant review (PGR), and inter partes review statistics provide proxies for the error rate in examination; grant-to-invalidation ratios, pendency times, and injunction rates serve as performance indicators for courts and offices.[22] Some empirical work, for instance, shows that the probability of a U.S. court issuing an injunction plummeted from over 95% pre-2006 to barely half thereafter (eBay), reshaping bargaining power in technology markets.[23] These institutional indicators help scholars link patent design choices to incentives and welfare, but they can be confounded by shifting litigation strategies, venue selection, and changes in pleading standards.[24]
6. Knowledge-Diffusion and Network Indicators
Patent citations create directed networks that trace technological flows; measures such as centrality, community structure, and betweenness have been deployed to map knowledge “bridges” and “brokers.”[25] Co-inventor networks, in turn, shed light on collaboration intensity, regional clustering, and labor mobility effects on inventive productivity.[26] These graph-based indicators can reveal path-dependent trajectories and emergent technological domains, but they are data-intensive and sensitive to name-disambiguation errors.[27]
A leading method for assessing importance, influence, or value of patents is eigenvector centrality and community detection.[28] Here, importance of patents is measured by computationally examining every citation from one patent document to another, as well as second, tertiary, etc., indirect citations.[29] It is a recent and powerful method that offers advantages over alternative methods.[30]
II. WIPO and Patent Indicators
A. WIPO and the World Intellectual Property Indicators
WIPO is a United Nations agency dedicated to the international governance of IP. WIPO administers international patent filing and registration systems (notably the PCT), and hosts platforms (e.g., PATENTSCOPE, Global Brand Database) that disseminate technological and legal information worldwide.[31]
WIPO’s World Intellectual Property Indicator reports are annual flagship publications that provide a comprehensive statistical overview of global IP activity for that year. The data in WIPI are drawn from an array of sources: primarily WIPO’s own IP Statistics Data Center, which aggregates administrative data from national and regional IP offices, and external sources like the World Bank (for GDP or research and development inputs) and UNESCO or industry associations (e.g., for contextual indicators on the creative sector).[32]
Typical contents include worldwide filing totals, breakdowns by country (or IP filing office) by origin of applicant, and trends over time.[33] Notably, WIPI reports track both “resident” filings (filed in the applicant’s home country) and “non-resident” filings (filed in other jurisdictions), as well as aggregates like patent families, which help to measure unique inventions across multiple filings.[34] This allows readers to distinguish domestic innovative activity from international technology flow.
WIPI has been refined to improve cross-country comparability—patent data includes “equivalent count[s]” to reflect the family of patent filings originating from a single invention.[35] This practice ensures WIPI’s comparisons are reasonably “apples-to-apples,” mitigating biases arising from different national practices in IP administration.[36]
Nevertheless, WIPI reports tend to rely on raw counts of phenomena that are easily measured (e.g., numbers of patent applications filed or issued), not more sophisticated metrics backed by deeper theoretical justification (e.g., importance metrics derived from the worldwide patent network, eigenvector centrality, and community detection methods).[37]
Relying on such superficial metrics for measuring aspects of patents can be misleading. Just as the Allies used inflatable tanks to trick the Nazis into overestimating the Allies’ invasion force during the Normandy Invasion of 1944,[38] counting patent applications or patent issuances can offer marked overestimates of patent quality. This Article suggests that overreliance on superficial indicators, such as those in the WIPI reports, might be better replaced by more robust metrics, such as importance.
B. Major Findings of the 2024 WIPI Report
The 2024 WIPI report reveals that patenting activity worldwide has reached an all-time peak.[39] According to the 2024 WIPI report, the growth of filings in 2023 was driven largely by a surge of additional applications from residents of five key countries—China, South Korea, the United States, Japan, and India—in that order.[40] The 2024 WIPI report’s data confirm that China is the epicenter of global patenting growth.[41]
In 2023, the National Intellectual Property Administration of the People’s Republic of China (CNIPA) received 1.68 million patent applications, a 3.6% increase from the year before.[42] China’s patent office alone accounted for roughly 47.2% of all patent filings worldwide in 2023, up from about 32% a decade earlier.[43] This means that China’s patent office now handles nearly as many applications as the rest of the world’s offices combined.[44] The United States, historically the leader in patent filings, ranked second with 598,085 applications received by the USPTO in 2023.[45] The United States total grew only marginally (+0.6%) from 2022, and the United States’s share of global filings stands at about 16.8%.[46]
The dramatic scale of Chinese patent filings has several implications. First, it reflects deliberate policy efforts: Since the 1990s, China has implemented a series of innovation-promotion policies, subsidies, and targets that encouraged domestic firms and research institutions to file patents.[47] Since 2015, China has consistently seen over a million patent applications per year, with over a fivefold increase in resident filings from 2010 to 2023, inevitably altering the global balance of patent activity.[48] One possible concern raised by commentators is whether China’s patent volume corresponds to commensurate innovative output or whether it is partly an artifact of subsidies and patenting for its own sake.[49] While the quality of patents is not directly measured in WIPI, the sheer volume has prompted discussions in the scholarly community about the need to ensure substantive examination capacity and patent quality in China’s system.[50]
From a legal perspective, China’s emergence as the top patent filer is a testament to the strengthening of its IP regime; a country that had no patent law until 1984 now not only generates IP but aggressively protects it.[51] This reverses historical patterns: For much of the twentieth century, most patent filings occurred in Western offices.[52] WIPO’s data for 2023 encapsulate this shift: China’s patent office by itself received more applications than the next eleven largest offices combined.[53]
By contrast, the United States has seen relatively static patent filing numbers. The USPTO’s 598,000 filings in 2023 represent modest growth from the mid-2010s, but the United States has essentially plateaued at around 600,000 applications annually.[54] However, the United States’s share of world patent filings keeps slipping as China’s share expands.[55] Some analysts have speculated that changes in United States’s patent law and jurisprudence over the past decade—for example, the possible tightening of patent eligibility (e.g., restrictions on software and biotech patents after Association for Molecular Pathology v. Myriad Genetics, Mayo Collaborative Services v. Prometheus Laboratories, and Alice Corp. v. CLS Bank International) and a perception of stronger validity challenges (PGRs) may have dampened domestic patenting in certain sectors.[56] It is difficult to draw direct causal links, but it is also possible that the United States’s innovation ecosystem is focusing on patent quality over quantity.
Nevertheless, the United States remains a technology powerhouse in terms of research and development (R&D) expenditure and—as this Article shows below—important inventions, but on the metric of patent filings, it now clearly ranks second by a large distance.[57] In addition, the patents in force in the United States are heavily populated by foreign-origin inventions—reflecting the country’s status as a crucial market for technology.[58] In fact, over half of active U.S. patents were granted to foreign applicants, a mirror image of China, where the vast majority of patents in force belong to domestic entities.[59] This dichotomy illustrates how the global patent system has bifurcated: China’s patent system primarily serves its domestic innovators (only approximately 20% of Chinese filings are from non-residents), whereas the United States serves as an international hub where innovators worldwide seek protection.[60] It is striking that Chinese firms both dominate domestic patenting and file many patent applications in the United States.[61]
The 2024 WIPI report also underscores trends in PCT filing. Although detailed PCT statistics are within the report, complementary WIPO publications show that approximately 272,600 PCT international applications were filed in 2023, representing a slight decline of 1.8% from 2022.[62] This dip—the first decrease in PCT filings in over a decade—was attributed to broader economic uncertainty and perhaps the tail end of the pandemic’s impact.[63] By 2024, PCT filings resumed growth, reaching about 273,900 applications.[64] Importantly, China has become the single largest source of PCT filings. In 2023, applicants from China filed roughly 70,000 PCT applications (26% of the total), slightly more than U.S. applicants who filed around 60,000 (22%).[65] This represents a changing of the guard—up until 2019 the United States was consistently the top PCT filing origin, but China has now firmly overtaken it.[66] For example, China’s Huawei Technologies, notably, has been the top corporate PCT filer for several years.[67]
The PCT data complement the domestic filing figures: They indicate which countries’ innovators are most active in seeking patent protection internationally. Here, the United States remains very prominent. According to WIPO’s analysis, the United States has led the world in “patent exports” (patent applications filed abroad) since 2013, having surpassed Japan.[68] In 2023, U.S.-resident inventors filed an estimated 190,000+ patent applications in other countries (including via PCT and directly in foreign patent offices).[69] Intriguingly, the 2023 data shows a divergent trend: The United States’s abroad filings dropped by 4.3%, the steepest decline among major economies.[70] China’s overseas filings were essentially flat from 2022 to 2023, but the decade-long view shows a 4.2-fold increase in Chinese abroad filings since 2013. This aligns with China’s strategic shift: Having built up a vast domestic patent portfolio, Chinese companies (especially in telecom, electronics, and increasingly in biotechnology) are now more aggressively filing in Europe, the United States, and other markets.[71] The 2024 WIPI report notes a sharp rise in Chinese patent filings in other “BRICS” (an acronym simply meaning Brazil, Russia, India, China, and South Africa) countries—in South Africa, Chinese applicants’ share of foreign patents went from just 2.5% in 2013 to 38.7% in 2023.[72] Such a strategy aligns with China’s Belt and Road initiative and broader global expansion of Chinese tech firms.
These international filing trends highlight a few phenomena. One is the growing interdependence of national patent systems: Innovations increasingly trigger filings in multiple jurisdictions, which puts pressure on harmonization and work-sharing among patent offices.[73] The surge in PCT usage means WIPO’s role in handling patent examination is ever more critical.[74] It also raises the question of patent quality and examination capacity. With such high volumes, patent offices (especially CNIPA and USPTO) face challenges to examine applications rigorously and timely.[75] WIPO’s data does not directly measure grant rates or pendency, but received wisdom often suggests backlogs and varying standards. Notably, a portion of China’s domestic filings are utility model patents (unexamined for novelty) or minor innovations, which may not all translate into granted patents or enforceable rights.[76]
WIPI indicates that when we focus on “patent families” (that is, a set of filings for the same invention in multiple countries), the gap between China and the United States narrows. In fact, WIPO found that U.S. applicants still create the most international patent families (filed in at least two countries), which are often seen as a proxy for high-value inventions.[77] According to the 2024 Highlights, the United States accounted for the largest share of foreign-oriented patent families in 2023, and was the largest source of non-resident filings in 14 of the top 20 patent offices worldwide.[78] This underscores that American companies remain extremely active globally, even if their absolute domestic filing numbers are not growing at China’s pace. It also reflects a strategic use of the patent system: Firms in advanced economies often file in key markets worldwide to secure their competitive positions, whereas many Chinese filings until recently were focused on the domestic market. However, as China’s tech industries mature, Chinese firms are now behaving similarly—seeking broad international protection.[79] The convergence is such that a recent study found China’s sectoral distribution of international patent filings is increasingly similar to that of the United States, especially in fields like digital communications and machinery.[80] In other words, China is no longer patenting only in low-tech or locally focused fields; it is patenting across the high-tech spectrum and doing so internationally.
The patent trends documented in the 2024 WIPI report carry several implications for legal policymakers and businesses. For one, the shift of innovation focus to China may influence future international IP norms. Countries that are now major generators of IP will have greater say in norm-setting discussions at WIPO or other forums. The fact that China and the United States are the two giants in patent filings could lead to a bipolar dynamic in global IP diplomacy, with Europe and Japan as important stakeholders but relatively diminished in quantitative terms. Policymakers in the United States and Europe, noting their declining shares, have initiated debates on how to maintain an innovation edge—for example, whether patent system reforms are needed to stimulate domestic patenting or to improve the attractiveness of their patent regimes for global applicants.[81] There is also an ongoing discussion about patent quality versus quantity. The WIPI data by itself does not resolve this, but the unprecedented volume of filings in certain offices (e.g., CNIPA) raises the question of whether some patent systems might be encouraging large numbers of filings of incremental inventions or defensive patents that contribute less to genuine technological advancement. If “patent thickets,” or proliferation of low-value patents, were to become widespread, the result could stifle competition and follow-on innovation—a concern that reinforces the need for rigorous examination standards.[82]
For WIPO and the international legal community, these trends underscore the importance of continued cooperation: As innovation transcends borders, frameworks like the PCT, and indeed WIPO itself, become ever more vital in managing the interdependencies. The data also serve as a reminder that IP law does not exist in a vacuum—it responds to and, in turn, influences innovation policy, economic strategy, and global competition.[83] WIPO’s mandate to “promote the protection of intellectual property” to contribute to technical innovation and to the transfer of technology appears more relevant than ever in light of the dynamic growth patterns captured in the 2024 WIPI report.[84] Going forward, ensuring that the patent system worldwide remains effective and balanced—incentivizing inventors while disseminating knowledge—will be the key legal challenge amid the boom in IP activity.[85]
On the other hand, if the indicators used in the WIPI are less salient than they appear, then shifts in the world of patent hegemony may not have been as tectonic as first suspected. Better indicators than those used by WIPI may suggest different conclusions about patent hegemons and substantial trends. The next Part of this Article introduces network science-based indicators whose use tells a very different tale about the rise of Chinese patents and the attendant decline of those from the United States.
III. Network Science and Importance as a Patent Indicator
A. Network Science, Bibliometrics, and “Importance”
In the study of scholarly communication, the concept of an article’s “importance” is often linked to how it sits within the scientific literature. Citations were recognized early on as a proxy for intellectual impact or importance.[86] This insight laid the groundwork for modern bibliometrics, where counting how often a paper is cited provides a first approximation of its impact or importance in its field.[87]
However, raw citation counts only capture one aspect of a publication’s prominence.[88] Here is where centrality—a key concept from network science—enriches our understanding of importance.[89] Centrality measures use graph theory to calculate the importance of each paper in the scientific ecosystem, reflecting not only raw citations, but potentially the quality or influence of those citing papers and its position in the overall structure of knowledge.[90]
The Eigenfactor algorithm weights citations by the influence of the source, rather than counting all citations equally.[91] The result is a measure that identifies journals (or articles) that sit at the center of the citation network.[92] Indeed, Eigenfactor and related metrics have been adopted as a “gold standard” for assessing journal influence, precisely because they exploit the rich structure of citation networks beyond raw counts.[93]
Such measures underscore an important point in the science of science: A publication’s importance is an emergent property of the entire citation ecosystem. An influential paper is one that not only accumulates citations but also occupies a central position in the network of ideas, as it is cited by other influential works and perhaps bridges multiple scholarly communities. In sum, network science and bibliometric indicators like centrality have transformed how we interpret importance in scholarly communication—from a simple tally of citations to a multidimensional understanding of influence and connectivity in the literature.
B. “Importance” as an Indicator in Patent Networks
Many of the same principles apply in the realm of patents, where citations form networks of technological information flow. Patent documents, much like scholarly articles, cite earlier patents (and sometimes scientific literature) as prior art.[94] Just as in science, one can ask whether a given patent is important in the context of this network. In the patent context, importance is often interpreted as a proxy for a patent’s technological significance or economic value, and citation-based measures of importance have indeed been widely used by economists and legal scholars as indicators of patent value.[95]
Early studies found that forward citation counts (the number of later patents that cite a given patent) correlate with how valuable or influential that patent is.[96] For instance, Manuel Trajtenberg’s classic work showed that patents referenced frequently (many forward citations) tended to represent high-value innovations.[97] Torrance and West have noted that “[c]itations to and from patents tend to be indicators of both private value to their owners and social value to society.”[98] Patent citation counts can signal whether a patent application is likely to be approved, and correlate with the likelihood of patent litigation.[99] Beyond pure economics, forward citations have been used as an indicator of the technological importance of an invention—the logic being that if many subsequent innovators build on a patent, it signals a significant technological advance.[100]
While raw citation counts can be useful for some purposes, Torrance and West have sought to refine the notion of patent importance by applying a full network analysis, analogous to the bibliometric approaches discussed above. Instead of simply counting citations, they construct the global citation network of U.S. patents and measure each patent’s importance by its position in that network.[101] This approach mirrors the Eigenfactor/PageRank method in scholarly networks: A patent is considered “important” if it is cited by other patents that are themselves important, taking into account the entire topology of citations rather than treating each citation equally. Torrance and West have called the resulting measure “patent importance”—a network-derived importance score—and they have provided evidence that patent importance corresponds closely to the intuitive notion of patent value.[102] In other words, a patent that ranks highly in the citation network (i.e., sits at a central, well-connected position among inventions) is likely to be a valuable patent in economic or technological terms.
The network approach adds nuance by weighing those citations. For example, their importance metric (built on an Article-Level Eigenfactor algorithm adapted for patents) would give less credit to self-citations or insular citations (which are less informative) and more to citations coming from widely cited, top-tier patents.[103] By incorporating this logic, the network-based indicator provides a more robust valuation signal. The upshot is a methodology for patent valuation that sidesteps many of the difficulties of traditional financial valuation methods (which rely on uncertain cash-flow projections or market comparables).[104]
The use of importance as an indicator in the patent field thus bridges law, economics, and information science.[105] It offers a quantitative, objective measure to identify patents that are likely to be technologically seminal or economically valuable.[106] Though it should be noted that the network-based importance metric is not intended to replace all other indicators, but to complement them. Patent value is a multifaceted concept, and no single indicator captures everything.[107] Nonetheless, citation-based importance has proven to be one of the most illuminating proxies.[108]
Employing importance as a patent indicator also allows an alternative view of the narrative of the WIPI, to wit that China is in the process of replacing, or already has replaced, the United States as a patent hegemon. The next Section of this Article tests the hypothesis that China has assumed the throne as patent queen.
IV. Methods
A. Data Source
The Authors were pleased to receive access to relevant data derived from the “Fall 2024” worldwide patent network calculated by PatentVector LLC (PatentVector or PV).[109] This data included a nearly complete set of thousands of data and metadata related to patents worldwide. In particular, the Authors were provided unique measures of (1) importance, including PV Score (a raw measure of patent importance), Normalized PV Score (a measure of patent importance that normalizes for patent age), mean PV Score, aggregate PV Score, individual patent document and simple patent family PV Score; (2) novelty, including Ingenuity Score (a measure of whether a patent discloses an invention that represents an incremental change or a radical departure, or anywhere in between, from the prior art); (3) technology type, as determined by clusters of patents present in the worldwide patent network, including specific cluster identifications; and (4) patent document count.
B. Network Analysis
The metrics and indicators in this study were ultimately derived from the worldwide patent network of about 175 million patent publications from about 200 countries or patent authorities. Using powerful arrays of neural networks situated on Amazon Web Services cloud servers, eigenvector centrality and community detection methods were used to calculate the worldwide patent network, assign importance (that is, “PV Score”) to every node, and identify roughly 31 million distinct, though nested, technology clusters. Such calculations require immense computational resources and exceptionally efficient algorithms; PatentVector LLC donated data produced by this expensive and extensive process of network building. Results of this network analysis are introduced and described in the next Section of this Article.
V. Results
Data, including importance, derived from the worldwide patent network calculated by PatentVector are presented here to illustrate various trends among continents, countries and patent authorities, and major classes of technology.
A. Worldwide Patent Trends Using Importance Indicators
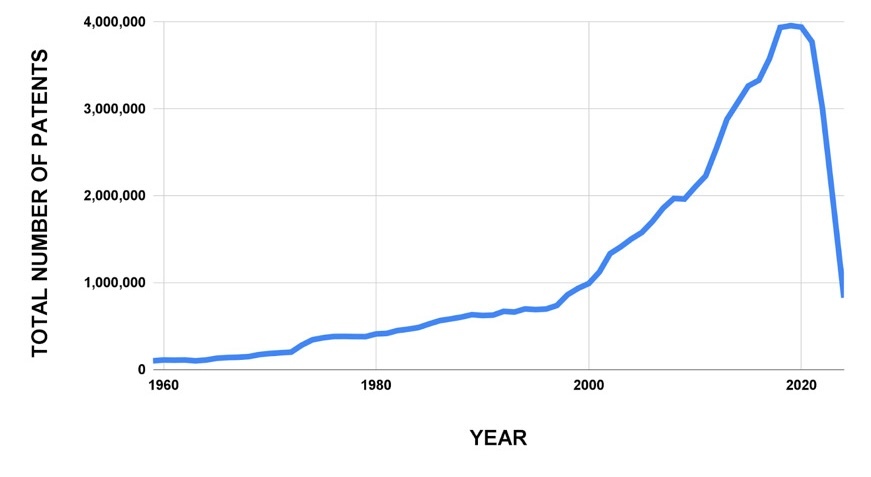
Figure 1 shows trends from 1960 until the fall of 2024 in the number of patent documents filed worldwide that are part of the worldwide patent network.

Figure 2 depicts trends from 1960 until the fall of 2024 in the number of patent documents representing the six major technology clusters filed worldwide that are part of the worldwide patent network.
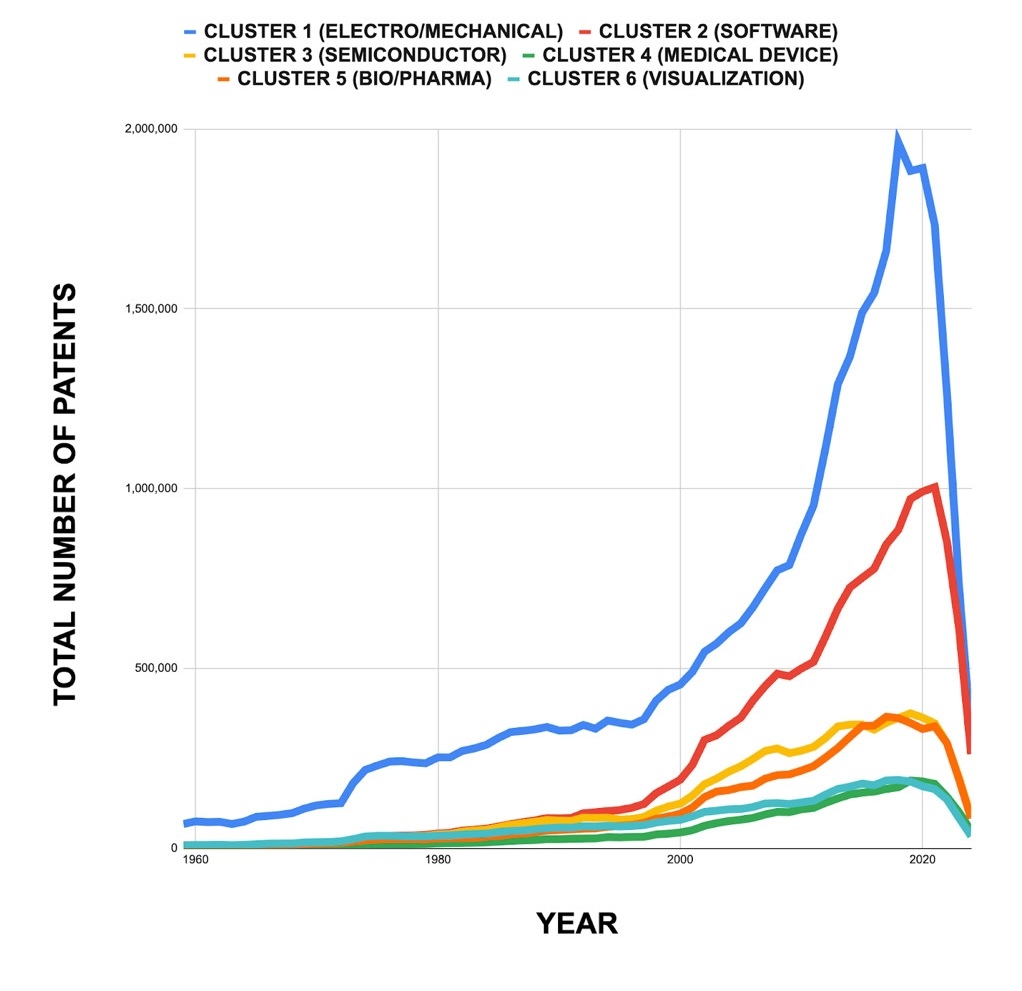
Figure 3 shows trends from 1960 until the fall of 2024 in the number of patent documents filed in the top twenty countries or patent authorities by the largest number of patent documents. The two-digit international patent country codes refer to China (CN), the United States (US), the European Patent Organization (EP), the World Intellectual Property Organization (WO), South Korea (KR), Japan (JP), Germany (DE), the United Kingdom (GB), Taiwan (TW), France (FR), Australia (AU), Russia (RU), Italy (IT), Austria (AT), Sweden (SE), the Netherlands (NL), Belgium (BE), Norway (NO), Spain (ES), and Canada (CA).
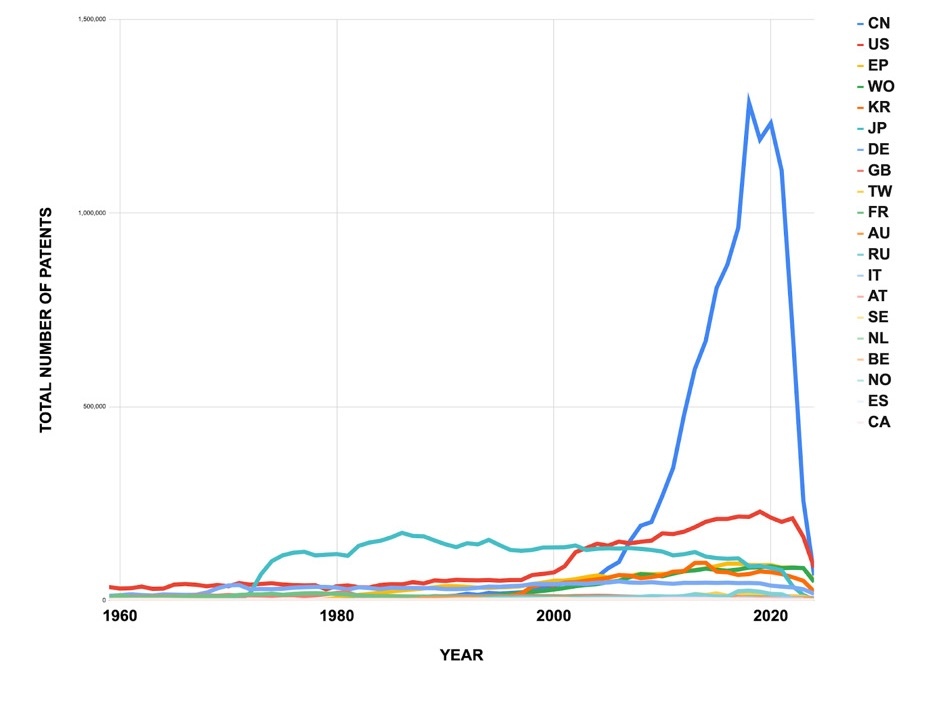
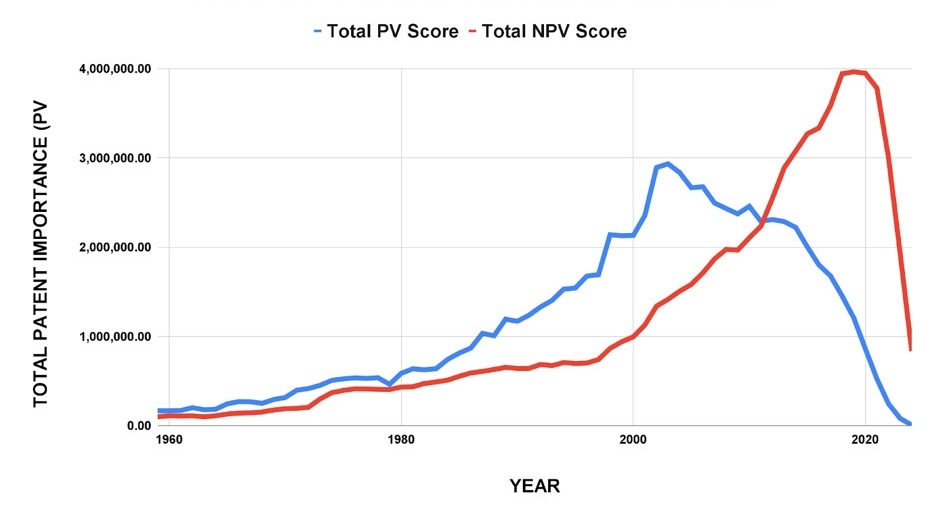
Figure 4 depicts trends in the importance of all patents in the worldwide patent network, showing both total unadjusted importance (i.e., importance that has not been adjusted to take into account when the priority patent application of a patent was originally filed, or “PV Score”) and total normalized importance (i.e., importance that has been normalized for patent age, or “NPV Score”).

Figure 5 illustrates trends from 1960 until the fall of 2024 for the six major technology clusters in the worldwide patent network, measured by total normalized importance (i.e., importance that has been normalized for patent age, or “NPV Score”).
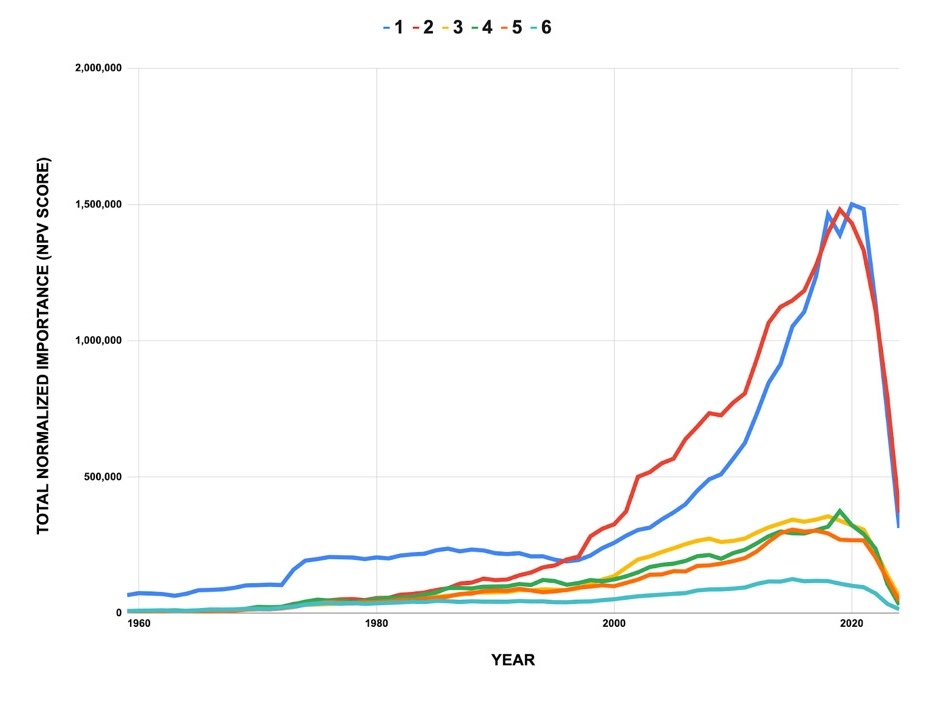
Figure 6 shows trends for top fifteen countries or patent authorities measured by total normalized importance (i.e., importance that has been normalized for patent age). The two-digit international patent country codes refer to China (CN), the United States (US), the World Intellectual Property Organization (WO), South Korea (KR), Japan (JP), the European Patent Organization (EP), Germany (DE), Taiwan (TW), the United Kingdom (GB), Canada (CA), France (FR), Australia (AU), Chile (CL), the Netherlands (NL), and Spain (ES).
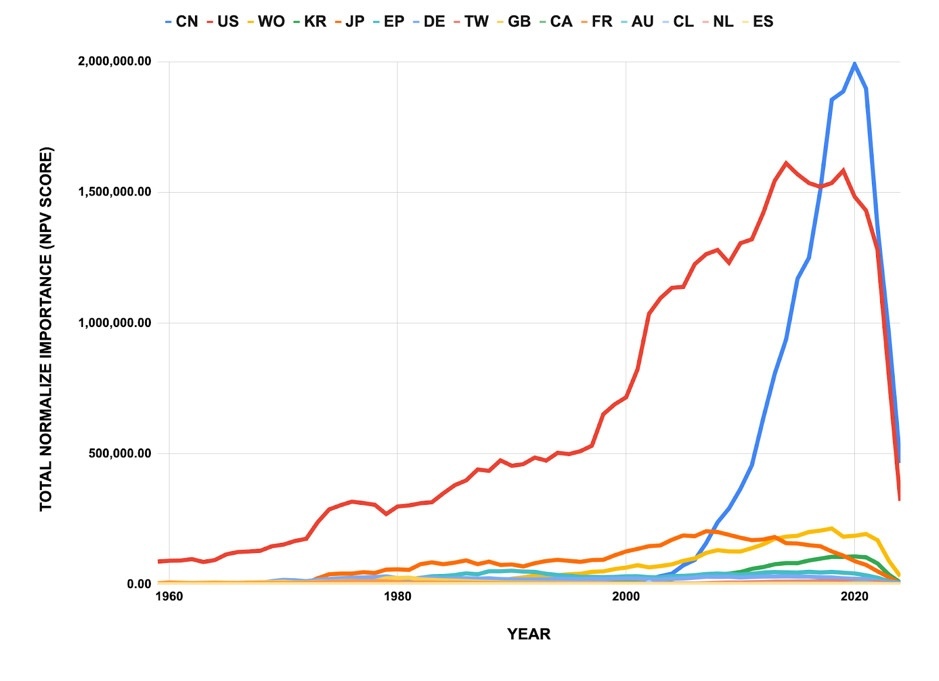
Figure 7 shows the trends in total normalized patent importance of the top five countries or patent authorities for technology cluster 1 (that is, inventions related to electro/mechanical technology) of the worldwide patent network.
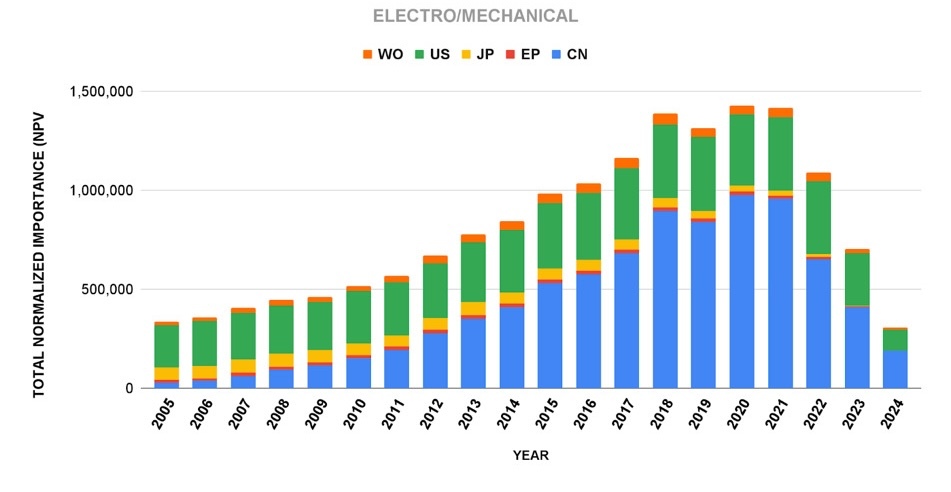
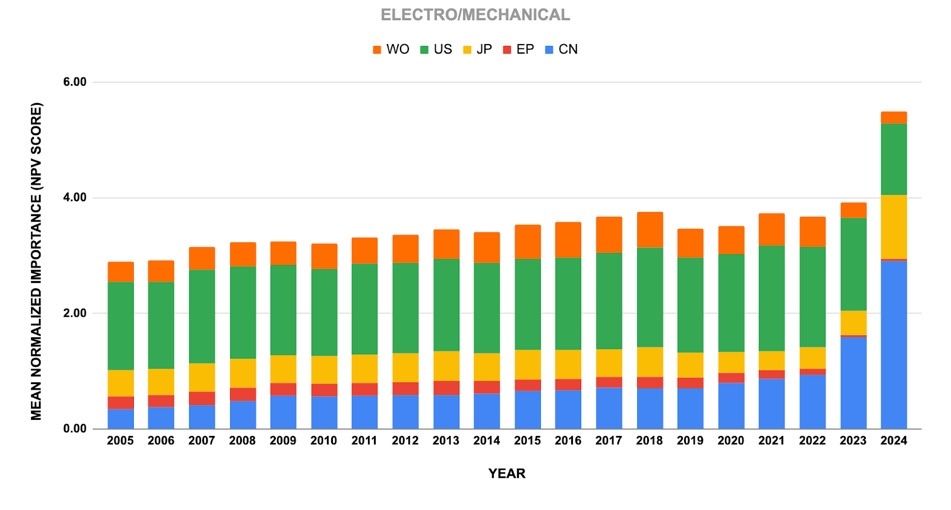
Figure 8 shows the trends in mean normalized patent importance of the top five countries or patent authorities for technology cluster 1 (that is, inventions related to electro/mechanical technology) of the worldwide patent network.

Figure 9 shows the trends in normalized patent importance of the top five countries or patent authorities for technology cluster 2 (that is, inventions related to software technology) of the worldwide patent network.
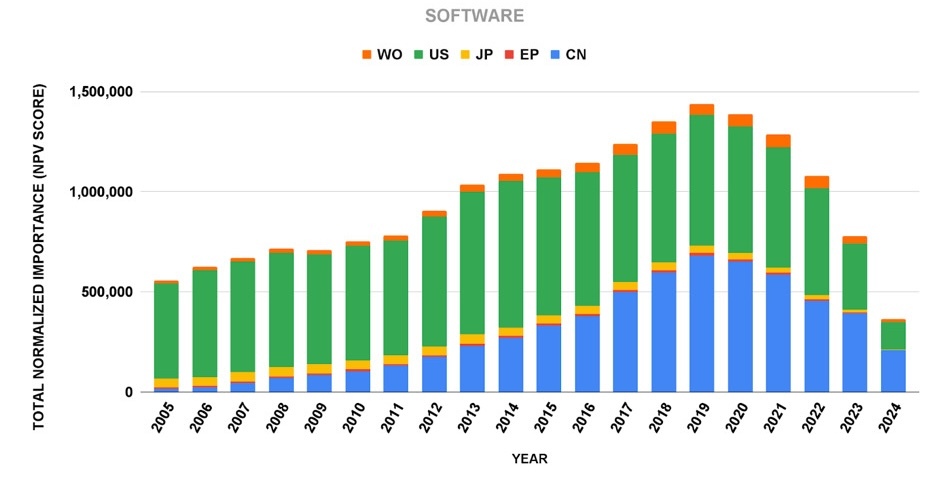
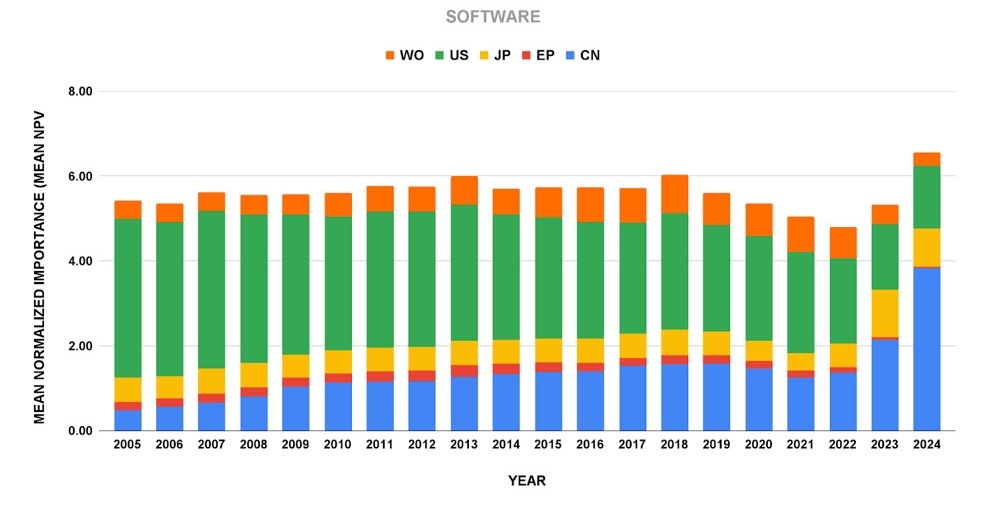
Figure 10 shows the trends in normalized patent importance of the top five countries or patent authorities for technology cluster 2 (that is, inventions related to software technology) of the worldwide patent network.

Figure 11 shows the trends in total normalized patent importance of the top five countries or patent authorities for technology cluster 3 (that is, inventions related to semiconductor technology) of the worldwide patent network.
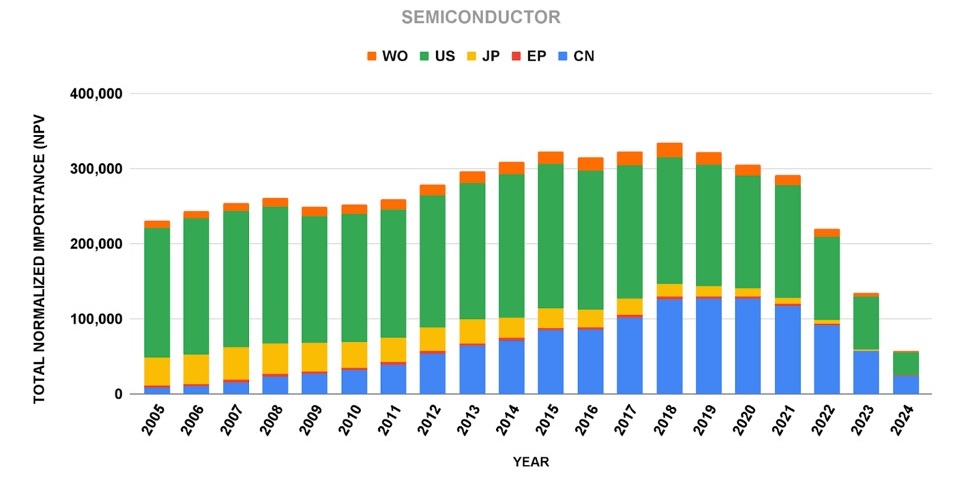
Figure 12 shows the trends in mean normalized patent importance of the top five countries or patent authorities for technology cluster 3 (that is, inventions related to semiconductor technology) of the worldwide patent network.
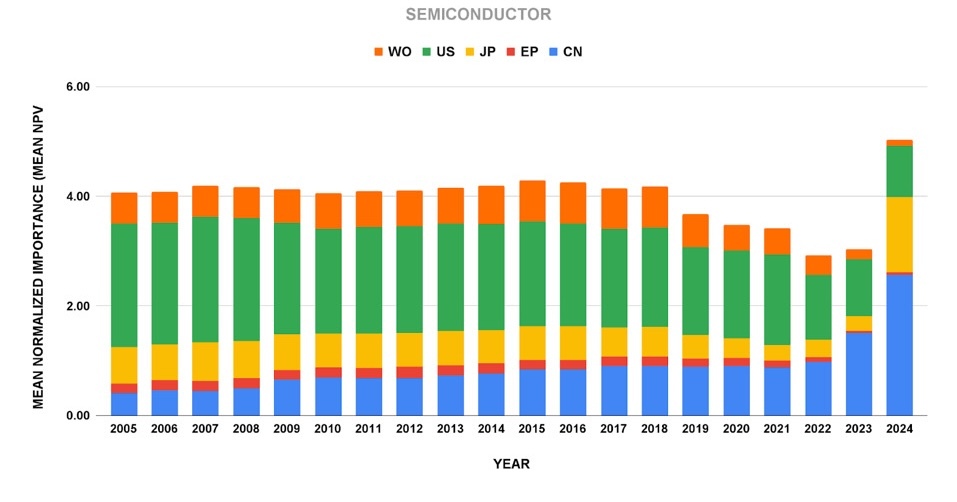
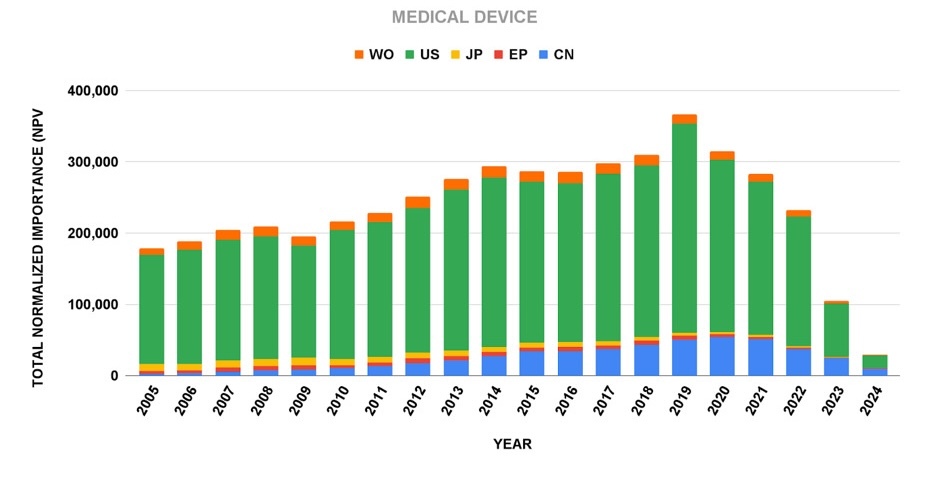
Figure 13 shows the trends in total normalized patent importance of the top five countries or patent authorities for technology cluster 4 (that is, inventions related to medical device technology) of the worldwide patent network.

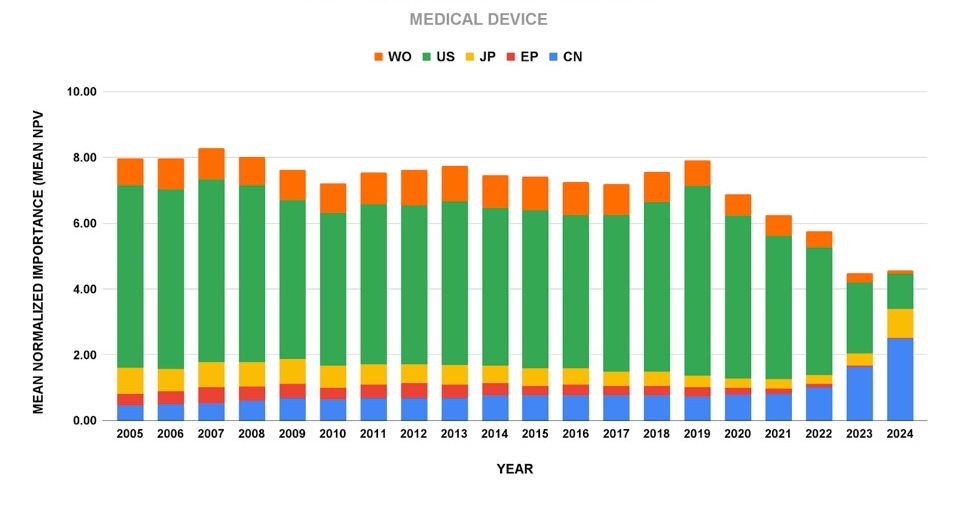
Figure 14 shows the trends in mean normalized patent importance of the top five countries or patent authorities for technology cluster 4 (that is, inventions related to medical device technology) of the worldwide patent network.

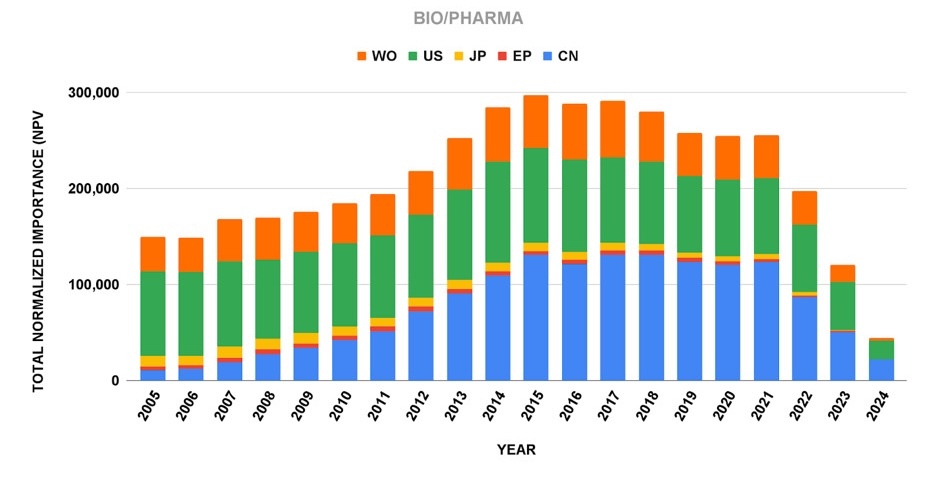
Figure 15 shows the trends in total normalized patent importance of the top five countries or patent authorities for technology cluster 5 (that is, inventions related to bio/pharma technology) of the worldwide patent network.

Figure 16 shows the trends in mean normalized patent importance of the top five countries or patent authorities for technology cluster 5 (that is, inventions related to bio/pharma technology) of the worldwide patent network.
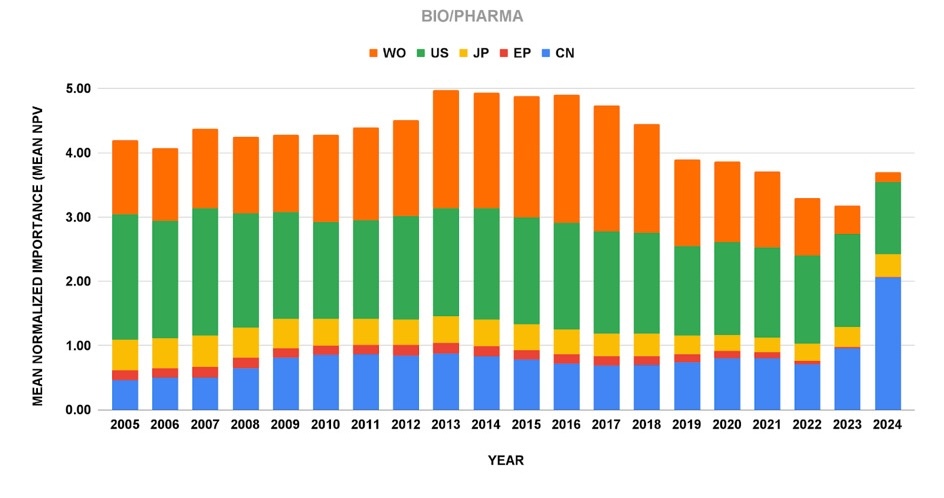
Figure 17 shows the trends in normalized patent importance of the top five countries or patent authorities for technology cluster 6 (that is, inventions related to visualization technology) of the worldwide patent network.
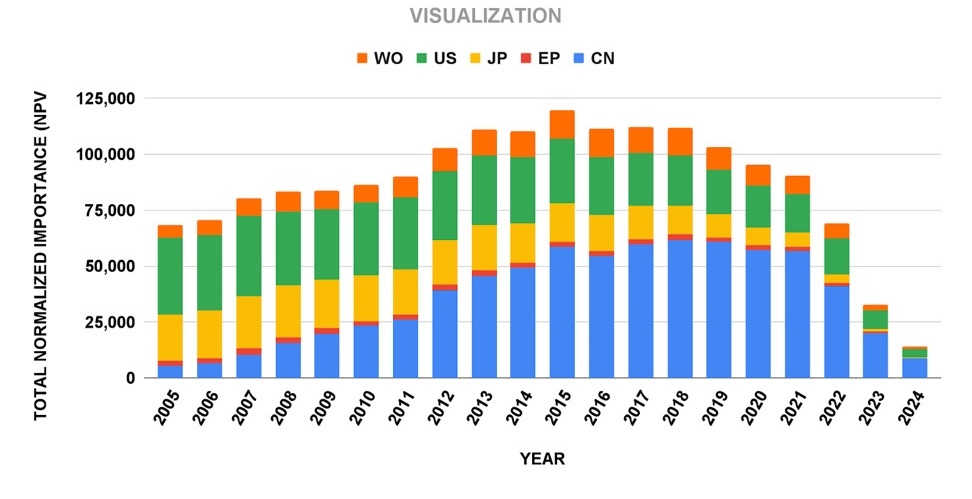
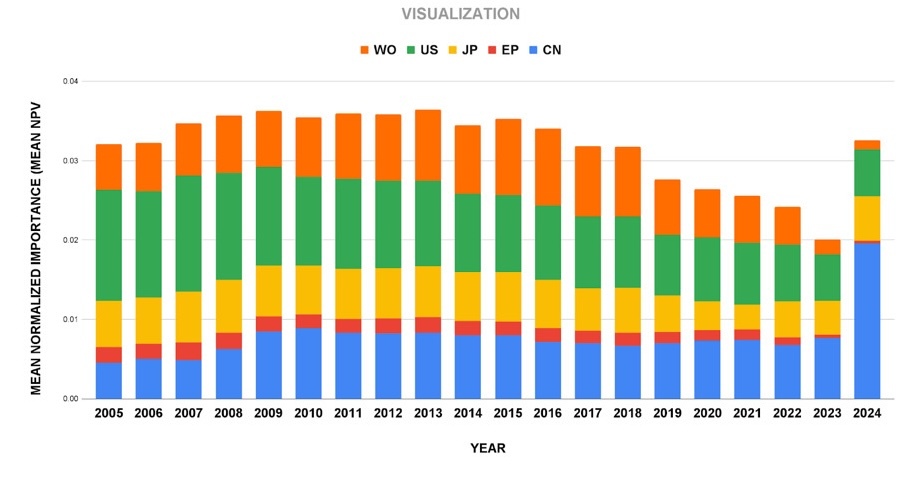
Figure 18 shows the trends in mean normalized patent importance of the top five countries or patent authorities for technology cluster 6 (that is, inventions related to visualization technology) of the worldwide patent network.
VI. Discussion of Patent Trends
The above figures collectively tell a nuanced story not only about the rapid rise of Chinese patent activity in recent years, but also the importance of the inventions claimed in its, and other countries’, patents. This story is not as straightforward as the WIPI indicators would seem to suggest. Far from a simple narrative of one country overtaking another, the data visualizations trace both quantitative surges and qualitative dimensions of innovation. In particular, they highlight how China’s meteoric ascent in patent filings contrasts with more subtle indicators of patent quality or impact, particularly total and mean normalized patent importance. Below, we derive insights from Figures 1 through 18, examining global trends, cross-country comparisons, and field-specific dynamics, revealing both dramatic changes and persistent differences among countries. We focus on what the data shows but also offer context about why trends might be as they are.
Figures 3 and 6 show that China has been rising rapidly not only in total numbers of patents, but also in the total importance of those patents. In fact, as Figures 7 to 18 illustrate, in some particular technology fields China is already the predominant patenting country in terms of total importance. Furthermore, as discussed below, China has achieved the first rank in the total importance of patents in several technology clusters. Nevertheless, the United States remains the preeminent patenting country for several particular areas of technology in terms of total importance. Moreover, when mean importance of patents is examined, the United States remains the dominant world technological power. In essence, when indicators based on patent importance, rather than raw patent counts, are relied upon, the story related in the 2024 WIPI report—of Chinese patent predominance and U.S. decline—is inaccurate. Using modern patent indicators backed by bibliometric theory demonstrates that reports of the death of U.S. patent preeminence are greatly exaggerated.[110]
A. General Trends in Patent Numbers (Figures 1–3)
Figure 1 shows that patent numbers have been rising since 1960, with a marked acceleration in this rise following 1995. This upward bend in patent trajectory comes on the heels of the April 15, 1994, signing and the January 1, 1995, coming into effect of the World Trade Organization Agreement on Trade-Related Aspects of Intellectual Property Rights in Marrakech, Morocco.[111] Under this treaty, patent term in signatory nations was standardized to last twenty years from filing date (rather than a period of years after issuance date), creating an incentive for efficient patent prosecution lest patent term be squandered.[112]
Figure 2 depicts the relative trends in patent numbers by major technological cluster. These clusters were identified via community detection in the global citation network (analyzing tens of millions of patents) and correspond to broad fields of technology. Cluster 1 corresponds to electro/mechanical technology, cluster 2 to software technology, cluster 3 to semiconductor technology, cluster 4 to medical device technology, cluster 5 to bio/pharma technology, and cluster 6 to visualization technology.[113] In the worldwide patent network, there are thousands of additional technological clusters[114], but all of them are orders of magnitude smaller than the big six; consequently, only the big six are discussed in this Article. All six clusters experienced the upward bend in patent trajectory after 1995. However, the electro/mechanical cluster rises by far the most, followed by the software cluster; much lower are the bio/pharma and semiconductor clusters; finally, and much lower still, are the medical device and visualization clusters.
Figure 3 illustrates the number of patent documents filed in the top twenty filing countries or patent authorities. The two-digit international patent country codes refer to China (CN), the United States (US), the European Patent Organization (EP), the World Intellectual Property Organization (WO), South Korea (KR), Japan (JP), Germany (DE), the United Kingdom (GB), Taiwan (TW), France (FR), Australia (AU), Russia (RU), Italy (IT), Austria (AT), Sweden (SE), the Netherlands (NL), Belgium (BE), Norway (NO), Spain (ES), and Canada (CA). The United States was the country with the most patent filings from 1960 to about 1970, after which Japan dominated patent filings until soon after 1980, when the United States assumed leadership again for a few years. Finally, after about 2003, the volume of Chinese patent filings rose to dominate the world, reaching about 4.5 times the U.S. volume just prior to 2020.
B. Patent “Importance” and Impact (Figures 4–6)
Figures 4 through 6 shift from traditional WIPO indicators, such as patent counts, to a network-based “patent importance” score derived from patent citation networks.[115] This metric (the eigenvector centrality of patents) weighs patents by how influential their citations are, serving as a proxy for technological significance.[116] Importance provides an alternative lens through which to examine patents—a lens that incorporates how other patents in a patent network view the influence or value of a patent of interest. In fact, a patent citation network built using eigenvector centrality results in an eigenvector score (here, a PV Score) derived from contributions made, either directly or indirectly, from every other patent in the network.[117] The field of bibliometrics often prefers importance metrics to simple counting when comparing interconnected references.[118] However, a disadvantage of importance methods stems from the simple fact that passage of time is required to accumulate citations. The more time that has passed, the more likely any patent of interest will have been cited by another patent. A consequence is that, as the age of a patent approaches zero (that is, the patent is brand new), the less confidence one should have in its calculated importance. To minimize this problem, we rely on importance scores up to about the year 2020, but discount importance scores or trends more recent than that.
Figure 4 shows trends in the importance of all patents in the worldwide patent network, showing both total unadjusted importance (i.e., importance that has not been adjusted to take into account when the priority patent application of a patent was originally filed, or “PV Score”) and total normalized importance (i.e., importance that has been normalized for patent age, or “NPV Score”). Total normalized importance scores peak long after raw importance. In this Article, we tend to rely on normalized importance scores on the grounds that they take into account the age of patents. The longer a period of time a patent has to accumulate citations, the more it will tend to accumulate. Because patent citations are the main input into calculating patent importance, calculating the importance of older and younger patents without any correction for age would tend to raise the importance of older patents and lower the importance of younger ones. Normalization by patent age reduces or, ideally, removes the advantage of age, allowing a more accurate comparison of importance scores among patents of all ages.
Figure 5 revisits the six major technological clusters, depicting trends in their total importance. From 1960 until about 1995, the total importance of the electro/mechanical cluster was markedly higher than that of any other technology. After that, a changing of the guards occurred, with the software technology cluster rising rapidly to overtake the electro/mechanical cluster. Both of these clusters converged around 2020. Lagging far behind, the total importance of the semiconductor, medical device, and bio/pharma technology clusters rose strongly in a tight pack from about 2000 to 2020. Bringing up the rear, the total importance of the visualization technology cluster rose modestly from about 1970 to 2015, after which it subsided gently.
Figure 6 revisits trends for the top fifteen countries or patent authorities as measured by total normalized importance (i.e., importance that has been normalized for patent age). From 1960 to about 2018, the United States dominated total normalized importance, rising steadily until about 1995, and then increasing its rate of rise markedly, until plateauing starting in about 2013. Starting from near nullity, the total importance of Chinese patents rose extremely rapidly after about 2002, shooting past the total importance of U.S. patents in about 2018. Both Japan and WIPO showed modest gains in total importance after about 1973, with Japan’s trend beginning a slow decline after about 2008. The total importance of South Korean patents has shown a modest rise between about 2010 and 2020.
In Figure 6, each cluster’s trajectory shows how its share of global innovative importance has changed. We can deduce some patterns. Software-related patents show a dramatic rise in importance starting in the late twentieth century, reflecting the software revolution and the increasing patentability of software in the United States (post-State Street Bank decision).[119] Semiconductor patents may have boomed earlier (e.g., mid-twentieth century, given the integrated circuit and electronics era) and could be plateauing as the field matures.[120] Medical devices may show a steady upward trend as global health-tech innovation grows, albeit from a smaller base.[121] The key insight from Figure 6 is the shift in where innovation impact is happening across fields, mirroring the broader technological transformation of economies.
C. Patent Predominance by Technology (Figures 7–18)
Figures 7–18 compare patent importance among the five most important patent jurisdictions: the United States, China, Japan, the EPO, and WIPO. They do so by focusing on specific technology domains, namely the six major technology clusters: cluster 1 corresponds to electro/mechanical technology, cluster 2 to software technology, cluster 3 to semiconductor technology, cluster 4 to medical device technology, cluster 5 to bio/pharma technology, and cluster 6 to visualization technology. This allows a comparison across technologies among the top five patent-producing countries or authorities using normalized total and mean patent importance over time. These granular views reveal that China’s patent ascendance (1) differs across different technologies, and, where present, (2) is only supported by the patent indicator of total importance. We consider each of the six major technology clusters in turn.
Figures 7 and 8 cover electro/mechanical technology (cluster 1). Figure 7 illustrates trends in total importance for cluster 1, encompassing general electrical and mechanical technology (e.g., automotive, machinery, household appliances, electrical equipment). Traditionally, the United States, Japan, and countries in the EPO have been powerhouses here, with extensive patent portfolios dating back many decades. Figure 9 shows a strong trend of modest U.S. growth in patent importance, shadowed by rapid growth in Chinese patent importance. Chinese total patent importance reached parity with U.S. total patent importance in 2013, then grew to exceed it by a substantial margin. Over this period of time, China made concerted progress in industries like machinery, transportation, and heavy engineering, being especially strong in manufacturing and hardware technologies.[122] Nevertheless, the story gets more complicated when mean patent importance is considered. Figure 8 illustrates that the mean importance of a U.S. patent in this cluster has consistently been far greater than for patents in China, Japan, the EPO, and WIPO from 1995 until 2020.[123] It is true that the mean importance of Chinese patents grew modestly during this period, but, from beginning to end, the mean importance of U.S. patents was far greater than those in any of the other jurisdictions compared.
Figures 9 and 10 cover software technology (cluster 2). Figure 9 displays trends in total importance for cluster 2, encompassing software, computer, and telecommunication technology (e.g., software programs, computer architecture, mobile phone communication signals).[124] Historically, the United States had an outsized lead in software patent importance.[125] One reason is that many foundational software and internet technologies were developed by American companies and universities in the 1990s and 2000s, and the U.S. patent system was more permissive in granting software patents, especially prior to the Alice Corp. v. CLS Bank International decision by the U.S. Supreme Court.[126] Figure 9 illustrates the United States’s traditional dominance in this technology: its total patent importance in the software cluster would tower above others through the 2000s. China’s trajectory in software is interesting, beginning with relatively few software patents and low total importance of those patents until the 2000s, but in the decade leading up to 2020 ballooning upward in total importance. By 2020, the total importance of U.S. and Chinese patents in cluster 2 had reached parity. Again, examination of trends in mean patent importance in cluster 2 tells quite a different story. From 1995 until 2020, the mean importance of U.S. software patents has towered over the mean importance of patents in the other four jurisdictions. True, there has been a gentle decline in the mean importance of U.S. patents, as well as a gradual rise for Chinese patents. However, U.S. patents in cluster 2 remain far more important on average than those of China or the other three jurisdictions. Thus, the software cluster offers an example of a technology in which China may be challenging the United States in quantity of patents, but the United States maintains a substantial lead in patent quality.
Figures 11 and 12 cover semiconductor technology (cluster 3). Figure 11 displays trends in total importance for cluster 3, encompassing a variety of computer chip and related technologies (e.g., silicon wafers, memory chips, hard-wired computer instructions, integrated circuits, chip design, fabrication processes). Figure 11 shows that the United States has dominated this technology cluster in terms of patent importance throughout the whole time period from 1995 to 2020. China started very low in total patent importance, but, by 2011, it had the second-highest amount of patent importance, after the United States. Over time, the total importance of U.S. semiconductor technology has decayed gradually, while the total importance of Chinese patents has increased slowly; yet, in 2020, the total importance of U.S. semiconductor patents remained much larger than the total importance of Chinese semiconductor patents. Figure 12 reinforces trends seen in Figure 11, presenting trends in mean patent importance that position U.S. patents far ahead of Chinese patents, despite slow but steady improvement by Chinese patents, and gradual decline of the mean importance of U.S. semiconductor patents. This finding resonates with policy discussions surrounding artificial intelligence because the United States still holds a semiconductor patent estate much more important in both total and mean metrics.
Figures 13 and 14 cover medical device technology (cluster 4). Figure 13 displays trends in total importance for cluster 4, encompassing a variety of medical device technologies (e.g., catheters, stents, pregnancy tests, continuous blood glucose sensors). Figures 13 and 14 present trends highlighting domination by the United States in both total and mean patent importance. China has made slow progress in catching up to the United States, but, even in 2020, its patents were overshadowed, in terms of both total and mean importance, by American medical device patent importance.
Figures 15 and 16 cover bio/pharma technology (cluster 5). Figure 15 displays trends in total importance for cluster 5, encompassing a variety of bio/pharma technologies (e.g., drugs, monoclonal antibodies, genome editors). This is a field where patents are often thought to be relatively more important, especially for encouraging investment over the multiple-year process of obtaining a license from the FDA (or its equivalent in other countries) to sell bio/pharma drugs on the market.[127] Figure 15 shows that the United States had the largest total patent importance until 2014, when it was superseded by China. China’s rise in total patent importance has been rapid, starting at a very low level in 2006, growing rapidly, and then dominating patent importance since 2014. This belies the conventional narrative that truly pioneering drug patents are still largely coming from the United States, and, to a lesser extent, European, firms, whereas Chinese tend to lag behind. In fact, mean patent importance supports this narrative. Figure 16 shows that, although the mean importance of Chinese patents in bio/pharma has grown steadily, the mean importance of U.S. patents has remained far higher from 1995 to 2020.
Figures 17 and 18 cover visualization technology (cluster 6). Figure 17 displays trends in total importance for cluster 6, encompassing a variety of visualization technologies (e.g., imaging, optics, lenses, copying methods). In terms of total importance, the United States was the leader from 2005 until recently, with Japan a strong second place; however, from 2005 to 2020, the total importance of Chinese patents rose strongly, surpassing Japan after 2010, and the United States after 2012. This technology cluster shows the clearest example of China climbing to patent dominance in a particular area. However, Figure 18 provides something of a counterweight, with China growing in mean patent importance from 2005 until 2010 but then declining slightly since then, surpassing the mean patent importance of Japan by 2009, but not exceeding the mean importance of U.S. patents at any point from 2005 to 2020.
When analyzed holistically, Figures 1–18 depict a complex set of trends in global innovation. China’s rise from virtually zero patent activity to towering prominence in patent filings is unequivocally documented in the early figures, but the later figures introduce critical context: patent counts alone do not equal technological supremacy. China’s patent boom, while remarkable in scale and change, is tempered by the reality that many of its patents have yet to achieve comparable impact to inventions produced in the United States.
At the same time, the figures also highlight how far China has come in a short time. A generation ago, China was nearly absent from charts of top inventing nations; now it is indispensable in every domain of innovation analysis.[128] The country is increasingly closing the quality gap, producing more internationally filed inventions and more citations to its work as its industries mature.[129] In field after field, from electro-mechanical to digital communications to medical technology, China’s trend lines in the figures are upward, often steeply so. The visual evidence thus supports a balanced conclusion: China has transformed the global patent landscape through extraordinary growth, but the quality of that growth has not matched its quantity. Importance patent indicators reveal a story of catch-up by China, and a continued lag in importance per patent. The United States continues to contribute patents of substantial total importance and has sustained its lead in mean importance across all six major technology areas. In this regard, importance patent indicators tell a very different story than do the patent count indicators relied upon in the WIPI.[130]
There is more to the story of the rise of Chinese patenting than raw patent counts. Indeed, we must look at qualitative indicators (or at least quality-adjusted quantitative indicators) to truly understand innovation leadership. WIPO’s WIPI report itself acknowledges this in part: Its introduction notes that volume is only a starting point and that the “challenge still remains quality” with respect to IP output.[131] This Article offers a more nuanced approach than raw patent counts, through analysis of patent citation networks to derive an “importance” score for patents (Figures 4–18).
Finally, it is worth mentioning the global implications for the patent system. With innovation activity shifting towards Asia, the center of gravity in IP policy might also shift. China and other emerging powers will have a greater say in international IP norm-setting as their portfolios and economic interests grow. We may see a more multipolar or bipolar dynamic—with the United States and China as the two giants—in global IP discussions. Already, WIPO’s Development Agenda emphasizes balanced IP systems that promote innovation but also knowledge diffusion, a principle that is increasingly pertinent when one country amasses patents at such volume.[132] The goal of the patent system is not patents for their own sake, but for promoting real innovation and societal progress. As such, the “explosion” in patent counts must be critically assessed: Is it fueling innovation or creating bottlenecks? Increased global participation in the patent system is evidence that innovation is broadening, which might help produce more high-quality inventions in the long run.
VII. Conclusion
While the United States has historically been a patent superpower, its growth in the number of patent filings has leveled off in recent years, causing its share of global filings to erode in the face of China’s relative avalanche of patent filings. Nonetheless, the United States remains a global leader in producing important inventions, even if its share of overall patent filings has fallen to second place behind China.[133] The United States continues to lead in mean patent importance, despite no longer being the leader in patent quantity in every technology category. Thus, any narrative of U.S. patent “decline” must be restricted to patent quantity, relative to China, but not average patent importance.
It is undeniable that the global landscape of patent activity has shifted dramatically, with China emerging as a dominant player by volume. The 2024 WIPI report confirms this with its documentation of patent trends up to 2023, highlighting that China has surpassed the United States in total patent applications filed.[134] However, this Article calls for the qualification of that claim: Despite China having overtaken the United States in volume of patent filings, network analysis shows that China still lags behind the United States in the mean importance of its patents across all major technology fields. The United States continues to maintain its technological leadership in terms of the mean importance of its patent filings, and its dominance in this regard appears unlikely to change in the near future. Though it is possible that China may one day overtake the United States in mean patent importance in a substantial number of technology clusters, this patent “Il sorpasso” has not yet occurred in any major technology cluster.[135]
China’s surpassing of the United States in total patent filings represents a watershed moment in the history of technological innovation metrics. The 2024 WIPI report data leave no doubt that by the traditional yardstick of patent counts, China is the new leader. This reflects a combination of China’s economic growth, pro-innovation policies, and strategic use of its new patent system to spur domestic R&D. In raw numbers alone, we are witnessing a reversal of historic trends as innovative activity shifts towards Asia, with China at the forefront.
Still, the United States has not stopped innovating, despite its flat filings trajectories and decreasing share of the global filing total.[136] This comparative analysis serves as a reminder that patent indicators must be interpreted with care. As Zvi Griliches cautioned decades ago, raw patent counts can be useful, but their accurate interpretation must occur in the context of additional information.[137] The 2024 WIPI report does this to a limited degree by providing patent counts alongside some contextual data (e.g., geographical information, technical data), but sole reliance on the 2024 WIPI report’s data can only provide a myopic view of the bigger patent picture.
The judicious use of importance indicators is essential, as they provide some of that missing supplementary interpretation, including demonstrating that more patents do not equal more innovation. The evidence from this analysis suggests that China’s patent boom, while a meaningful indicator of innovative capacity and policy emphasis, does not automatically equate to technological supremacy. In other words, the quantity of China’s patents is not commensurate with the importance of its patents.
It will be fascinating to see whether China’s trajectory continues unabated, or whether it slows as China shifts focus from quantity to importance. Chinese authorities may begin emphasizing higher-quality patents and discouraging frivolous filings (made only to hit numeric targets). If so, the torrent of filings may moderate, but even if it does, increased emphasis on quality could lead to an increase in the technological importance of Chinese patents. Chinese inventors and firms may also opt to file more patents in other jurisdictions as well; the 2024 WIPI report provides insights into this trend, particularly through data on PCT applications and other foreign filings, such as those in BRICS nations.[138] Meanwhile, the United States and the rest of the world face the challenge of how to respond to China’s patent rise. Responses could be defensive and protectionist, attempting to insulate national technological markets from the onslaught of Chinese technological innovations. However, a more beneficial outcome for the welfare of the world, including humanity, would be for other countries to learn from the impressive example of China’s patent rise, and to redouble their efforts to compete by engaging in high-quality innovation, and by fostering and protecting such innovation at least in part with important patents.
Portions of this Article were researched, drafted, and/or revised in collaboration with ChatGPT (GPT-o3-pro, May 2025) and Anthropic’s LLM Claude (Sonnet, May 2024). All content was reviewed and verified by the research team. To ensure ethical and responsible use of AI, we engaged with LLMs in line with best practices described in Bill Tomlinson, Andrew W. Torrance & Rebecca W. Black, ChatGPT and Works Scholarly: Best Practices and Legal Pitfalls in Writing with AI, 76 SMU L. Rev. F. 108, 117 (2023) and Tools Such as ChatGPT Threaten Transparent Science; Here Are Our Ground Rules for Their Use, nature (Jan. 24, 2023), https://www.nature.com/articles/d41586-023-00191-1 [https://perma.cc/3GRY-CD77].
Evidenced by the usage of IP metrics by various scholars. E.g., Luis Felipe Beltrán-Morales et al., Effects of the Utilization of Intellectual Property by Scientific Researchers on Economic Growth in Mexico, PLOS ONE, Oct. 13, 2021, at 1, 11.
WIPO, World Intellectual Property Indicators 2024, at 71–72 (2024) [hereinafter 2024 WIPI Report], https://www.wipo.int/edocs/pubdocs/en/wipo-pub-941-2024-en-world-intellectual-property-indicators-2024.pdf [https://perma.cc/JE2K-6E5E].
Cristian Mejia & Yuya Kajikawa, Patent Research in Academic Literature. Landscape and Trends with a Focus on Patent Analytics, Frontiers Rsch. Metrics & Analytics, Jan. 8, 2025, at 1, 11–13.
WIPO China: Harnessing IP to Drive Innovation and Global Collaboration, WIPO (Mar. 18, 2025), https://www.wipo.int/en/web/office-china/w/news/2025/wipo-china-harnessing-ip-to-drive-innovation-and-global-collaboration [https://perma.cc/FA2E-QNSV]; World Intellectual Property Indicators Report: Global Patent Filings Reach Record High in 2023, WIPO (Nov. 7, 2024), https://www.wipo.int/pressroom/en/articles/2024/article_0015.html [https://perma.cc/F34G-F2FA].
See Org. for Econ. Co-Operation & Dev., OECD Patent Statistics Manual 13, 138 (2009), https://www.oecd.org/content/dam/oecd/en/publications/reports/2009/02/oecd-patent-statistics-manual_g1gh9fa4/9789264056442-en.pdf [https://perma.cc/XZ7T-SUT6].
Zvi Griliches, Patent Statistics as Economic Indicators: A Survey, 28 J. Econ. Literature 1661, 1684, 1686 (1990); Sandro Mendonça, Hugo Confraria & Manuel Mira Godinho, Appropriating the Returns of Patent Statistics: Take-Up and Development in the Wake of Zvi Griliches 31 (Sci. Pol’y. Rsch. Unit, Working Paper No. 07, 2021).
Org. for Econ. Co-Operation & Dev, supra note 6, at 60–64.
Id. at 61.
Hélène Dernis & Mosahid Khan, Triadic Patent Families Methodology 23 (OECD Sci., Tech. & Indus., Working Paper No. 2004/02, 2004).
See Sadao Nagaoka, Kazuyuki Motohashi & Akira Goto, Patent Statistics as an Innovation Indicator, in 2 Handbook of the Economics of Innovation 1083, 1101 (Bronwyn H. Hall & Nathan Rosenberg eds., 2010).
See Anna Vadeike, Challenges of IP Valuation Across Different Jurisdictions, Royalty Range (Jan. 16, 2025), https://www.royaltyrange.com/news/challenges-of-ip-valuation-across-different-jurisdictions/ [https://perma.cc/K6SW-UQEB]; Sjoerd Hardeman et al., An Analysis of National Research Systems (I): A Composite Indicator for Scientific and Technological Research Excellence 34, 38–39 (2013), https://publications.jrc.ec.europa.eu/repository/bitstream/JRC83723/lbna26093enn.pdf [https://perma.cc/6B7J-BBJ2].
Bronwyn H. Hall, Adam Jaffe & Manuel Trajtenberg, Market Value and Patent Citations, 36 Rand J. Econ. 16, 18–19 (2005); Dietmar Harhoff et al., Citation Frequency and the Value of Patented Invention, 81 Rev. Econ. & Stat. 511, 514–15 (1999).
Alfonso Gambardella, Dietmar Harhoff & Bart Verspagen, The Value of European Patents, 5 Eur. Mgmt. Rev. 69, 70–72, 79–82 (2008).
The Power of Patent Citations, minesoft, https://minesoft.com/the-power-of-patent-citations [https://perma.cc/S68U-VQZA] (last visited Oct. 4, 2025).
Mark Schankerman & Ariel Pakes, Estimates of the Value of Patent Rights in European Countries During the Post-1950 Period 5, 28 (Nat’l Bureau of Econ. Rsch., Working Paper No. 1650, 1985).
Ariel Pakes & Margaret Simpson, Patent Renewal Data, 1989 Brookings Papers on Econ. Activity: Microeconomics 331, 372–75, 385–90.
Hall, Jaffe & Trajtenberg, supra note 13, at 29–30.
Taorui Guan, Investors’ Perspective on Intellectual Property Financing, 54 Seton Hall L. Rev. 439, 449–50, 462, 470–71 (2023); Arne Führer et al., Final Report from the Expert Group on Intellectual Property Valuation 62, 77 (2013), https://www.pure.ed.ac.uk/ws/portalfiles/portal/18765027/Expert_Group_Report_on_Intellectual_Property_Valuation_IP_web_2.pdf [https://perma.cc/GG7C-ZAUD].
Finjan, Inc. v. Blue Coat Sys., LLC, No. 15-cv-03295-BLF, 2016 WL 6873541, at *5, *7–8 (N.D. Cal. Nov. 22, 2016); Christopher B. Seaman, Permanent Injunctions in Patent Litigation After eBay: An Empirical Study, 101 Iowa L. Rev. 1949, 1974, 1978–79 (2016).
See, e.g., Sam Horner et al., Standing Your Ground: Examining the Signaling Effects of Patent Litigation in University Technology Licensing, Rsch. Pol’y, July 20, 2022, at 1, 9.
Brian J. Love, Shawn P. Miller & Shawn Ambwani, Determinants of Patent Quality: Evidence from Inter Partes Review Proceedings, 90 U. Colo. L. Rev. 67, 89, 93, 96, 100 (2019).
Seaman, supra note 20, at 2001–02, 2004, 2006.
Colleen Chien, Christian Helmers & Alfred Spigarelli, Inter Partes Review and the Design of Post-Grant Patent Reviews, 33 Berkley Tech. L.J. 817, 824, 840–42 (2018).
Stefano Breschi & Francesco Lissoni, Knowledge Networks from Patent Data, in Handbook of Quantitative Science And Technology Research 613, 630–32 (Henk F. Moed et al. eds., 2004).
Brit Sharoni, The Effect of Inventor Mobility on Network Productivity 29 (June 19, 2024) (unpublished comment), https://www.brit-sharoni.com/content/papers/InventrorsMobilityStayersProductivity_Sharoni.pdf [https://perma.cc/J4FU-ZMDW].
Yingying Ma, Youlong Wu & Chengqiang Lu, A Graph-Based Author Name Disambiguation Method and Analysis via Information Theory, Entropy, Apr. 7, 2020, at 1, 3–4.
Andrew W. Torrance & Jevin D. West, All Patents Great and Small: A Big Data Network Approach to Valuation, 20 Va. J.L. & Tech. 466, 485, 500–02 (2017).
Jianming Guo, Using the Node Importance of Patent Network to Evaluate Patent Relational Value, PLOS One, July 1, 2025, at 1, 3, 6.
Andrew W. Torrance & Jevin D. West, Patent Analytics: Information from Innovation, in Legal Informatics 257, 267, 270–72 (Daniel M. Katz, Ron Dolin & Michael J. Bommarito eds., 2021); see also Torrance & West, supra note 28, at 472–73, 479 (explaining various approaches for evaluating patent value).
Holger Hestermeyer, World Intellectual Property Organization (WIPO), in Elgar Encyclopedia of International Economic Law 129, 131 (Thomas Cottier & Krista Nadakavukaren Schefer eds., 2017); PATENTSCOPE Database: Terms of Use, WIPO (Oct. 2025), https://www.wipo.int/en/web/patentscope/data/terms_patentscope [https://perma.cc/B7FA-YSN9]; Global Brand Database: Terms of Use (November 2022), WIPO (Nov. 2022), https://www.wipo.int/en/web/global-brand-database/terms_and_conditions [https://perma.cc/Z64V-9ZSH].
2024 WIPI Report, supra note 3, at 173; WIPO, World Intellectual Property Indicators 2023, at 168 (2023).
2024 WIPI Report, supra note 3, at 9, 11–14, 19.
Id. at 9, 15–16.
Id. at 13.
Id.
See id. at 9.
Officially known as “Operation ‘Fortitude.’” See D-Day’s Parachuting Dummies and Inflatable Tanks, IWM, https://www.iwm.org.uk/history/d-days-parachuting-dummies-and-inflatable-tanks [https://perma.cc/YK7A-64GH] (last visited Aug. 26, 2025).
2024 WIPI Report, supra note 3, at 9.
Id.
Id.
Id. at 10.
Id.
Id.
Id. at 10, 12.
Id. at 7.
Cheryl Xiaoning Long & Jun Wang, China’s Patent Promotion Policies and its Quality Implications, 46 Sci. & Pub. Pol’y 91, 94 (2019).
2024 WIPI Report, supra note 3, at 9–10.
Genevieve Heng, Martin Husovec & Jorge L. Contreras, Patentomania: The Cost of Embedding Patents in Social Policies (Univ. of Utah Coll. of L., Working Paper No. 581, 2023), https://papers.ssrn.com/sol3/papers.cfm?abstract_id=4666059 [https://perma.cc/A5PX-VFS4].
Alex He, What Do China’s High Patent Numbers Really Mean?, Centre for Int’l Governance Innovation (Apr. 20, 2021), https://www.cigionline.org/articles/what-do-chinas-high-patent-numbers-really-mean/ [https://perma.cc/LAQ9-CRS2]. See generally 2024 WIPI Report, supra note 3 (reporting the number of patents filed but not the quality of those patents and offering general statements about the quality of certain types of filings but not quantifiably or specific to a county’s overall patent application quality).
Wen Xikai, Latest Developments of Patent System in Mainland China, CNIPA (Jan. 2, 2004), https://english.cnipa.gov.cn/transfer/news/officialinformation/1121581.htm [https://perma.cc/ZSA3-2XHN].
Geoff Maslen, Five Nations Dominate Global Innovation – WIPO Report, Univ. of Ill. Chi.: Graduate Coll. (Dec. 2, 2019), https://grad.uic.edu/news-stories/five-nations-dominate/ [https://perma.cc/C6DR-DT56].
2024 WIPI Report, supra note 3, at 31.
Id. at 26–27.
Id. at 9.
Jonathan S. Masur & Adam K. Mortara, Patents, Property, and Prospectivity, 71 Stan. L. Rev. 963, 995, 1002 (2019); see also Ass’n for Molecular Pathology v. Myriad Genetics, Inc., 569 U.S. 576, 580, 596 (2013) (demonstrating the increased restrictions on biotech patents); Mayo Collaborative Servs. v. Prometheus Laboratories, Inc., 566 U.S. 66, 87–90 (2012) (demonstrating that biotech inventions are not necessarily patentable); Alice Corp. v. CLS Bank Int’l., 573 U.S. 208, 217–19, 221–23 (2014) (demonstrating the increased restrictions on software patents).
WIPO, Global Innovation Index 2024: Unlocking the Promise of Social Entrepreneurship 28–29, 38 (Soumitra Dutta et al. eds., 17th ed. 2024), https://www.wipo.int/web-publications/global-innovation-index-2024/assets/67729/2000 Global Innovation Index 2024_WEB3lite.pdf [https://perma.cc/AVC9-SU5N].
2024 WIPI Report, supra note 3, at 16; Nat’l Sci. Board, The State of U.S. Science & Engineering 2024, at 25–26 (2024), https://ncses.nsf.gov/pubs/nsb20243/translation-u-s-and-global-science-technology-and-innovation-capabilities [https://perma.cc/JN35-GD9K].
Kirk Hartung, 2022 U.S. Patent Filings Statistics, McKee, Voorhees & Sease, PLC (Jan. 18, 2023), https://www.filewrapper.com/2022-u-s-patent-filings-statistics/ [https://perma.cc/2PP9-BNRA]; 2024 WIPI Report, supra note 3 at 19.
2024 WIPI Report, supra note 3, at 16, 19.
See Zheng Liang & Lan Xue, A Tale of Two Cities: A Comparison of Patent-based Innovative Performance of Domestic and Multinational Companies in China, J. Int’l. Comm. & Econ., May 2011, at 17, 45–46.
WIPO, Executive Summary: Patent Cooperation Treaty Yearly Review 2024: The International Patent System 2 (2024), https://www.wipo.int/edocs/pubdocs/en/wipo-pub-901-2024-exec-summary-en-patent-cooperation-treaty-yearly-review-2024-executive-summary.pdf [https://perma.cc/935Y-R95Y].
Maura O’Malley, WIPO Reports Return to Growth in Patents and Trademarks Filings in 2024, Glob. Legal Post (Mar. 17, 2025), https://www.globallegalpost.com/news/wipo-reports-return-to-growth-in-patents-and-trademarks-filings-in-2024-370660738# [https://perma.cc/T65B-4AHN].
Use of WIPO’s Global IP Registries for Patents, Trademarks and Designs Grew in 2024, WIPO (Mar. 17, 2025), https://www.wipo.int/pressroom/en/articles/2025/article_0003.html [https://perma.cc/MFK6-RBSS].
Id.; 2024 WIPI Report, supra note 3, at 16–17, 60, 62.
China Becomes Top Filer of International Patents in 2019 Amid Robust Growth for WIPO’s IP Services, Treaties and Finances, WIPO (Apr. 7, 2020), https://www.wipo.int/pressroom/en/articles/2020/article_0005.html [https://perma.cc/J8SG-W9LY].
O’Malley, supra note 63.
2024 WIPI Report, supra note 3, at 13.
Id. at 13–14.
Id. at 13.
See id. at 9–10, 13–14; Liang & Xue, supra note 61, at 24, 44–45.
2024 WIPI Report, supra note 3, at 14.
Id. at 15–16.
Use of WIPO’s Global IP Registries for Patents, Trademarks and Designs Grew in 2024, supra note 64.
U.S. Gov’t Accountability Off., GAO-25-107218, Intellectual Property: Patent Office Should Strengthen Its Efforts to Address Persistent Examination and Quality Challenges 4, 7–8 (2025); China to Expedite Patent Application Review Process, The State Council: China (Apr. 9, 2024, at 14:29 CT), https://english.www.gov.cn/news/202404/09/content_WS6614e065c6d0868f4e8e5e1d.html [https://perma.cc/EVU3-FAW9].
U.S. Chamber of Commerce, China’s Utility Model Patent System: Innovation Driver or Deterrent (2012), reprinted in Thomas T. Moga, Sedona Conference (2016), https://www.thesedonaconference.org/sites/default/files/conference_papers/%255B25%255D%2520Moga%252C%2520China%2527s%2520Utility%2520Model%2520Patents_Innovation%2520Driver%2520or%2520Deterrent%2520%25282012%2529.pdf [https://perma.cc/9SR4-EKW3].
2024 WIPI Report, supra note 3, at 15–16.
See id. at 10, 14, 16.
Robert D. Atkinson, China Is Rapidly Becoming a Leading Innovator in Advanced Industries, ITIF (Sep. 16, 2024), https://itif.org/publications/2024/09/16/china-is-rapidly-becoming-a-leading-innovator-in-advanced-industries/ [https://perma.cc/PC9E-CWT9].
François de Soyres, Ece Fisgin & Ana Maria Santacreu, From Partner to Rival: Understanding China’s Technological Rise Through Patent Data, Fed. Rsrv Bank of St. Louis: On the Economy Blog (Apr. 3, 2025), https://www.stlouisfed.org/on-the-economy/2025/apr/understanding-china-technological-rise-patent-data [https://perma.cc/3PAA-WYSC]; Atkinson, supra note 79.
See Emily G. Blevins, Cong. Rsch. Serv., R47267, Patents and Innovation Policy 14–15, 17–18 (2022); Susan S. DeSanti et al., Fed. Trade Comm’n, To Promote Innovation: The Proper Balance of Competition and Patent Law and Policy 5, 7–8, 10, 15–16 (Oct. 2003), https://www.ftc.gov/sites/default/files/documents/reports/promote-innovation-proper-balance-competition-and-patent-law-and-policy/innovationrpt.pdf [https://perma.cc/A5CV-DJQU]; Shona Murray, US Instability Opens Door for European Innovation – European Patent Chief, euronews (Apr. 24, 2024, at 17:30 GMT +2), https://www.euronews.com/my-europe/2025/04/24/us-instability-opens-door-for-european-innovation-european-patent-chief [https://perma.cc/H6G8-RCYQ].
Bronwyn H. Hall et al., Intell Prop. Office, A Study of Patent Thickets 30–31 (2013), https://assets.publishing.service.gov.uk/media/5a7dc04ded915d2acb6edea7/ipresearch-thickets.pdf [https://perma.cc/SU4U-7UKZ].
See Timothy J. Muris, Competition and Intellectual Property Policy: The Way Ahead, Fed. Trade Comm’n (Nov. 15, 2001), https://www.ftc.gov/news-events/news/speeches/competition-intellectual-property-policy-way-ahead [https://perma.cc/7TKL-734Y]; Inma Sumaita, The Importance of Being Earnestly Innovative: The Increasing Role of Intellectual Property Law in the Global Economy, U. Cin. Intell. Prop. & Comput. L.J., Dec. 2021, at 1, 4, 8.
Convention Establishing the World Intellectual Property Organization art. 3 (emphasis added).
Carolyn Deere Birkbeck, The World Intellectual Property Organization (WIPO): A Reference Guide 9 (2016).
Leonidas Aristodemou & Frank Tietze, Citations as a Measure of Technological Impact: A Review of Forward Citation-Based Measures, 53 World Pat. Info 39, 40 (2018).
Ashok Agarwal et al., Bibliometrics: Tracking Research Impact by Selecting the Appropriate Metrics, 18 Asian J. Andrology 296, 298–99 (2016).
Michael R. Dougherty & Zachary Horne, Citation Counts and Journal Impact Factors Do Not Capture Some Indicators of Research Quality in the Behavioural and Brain Sciences, Royal Soc. Open Sci., Aug. 17, 2022, at 1, 13, https://royalsocietypublishing.org/doi/epdf/10.1098/rsos.220334 [https://perma.cc/F2YR-HEB3].
Kuang-Chang Chai et al., Determinants of Highly-Cited Green Patents: The Perspective of Network Characteristics, PLOS One, Oct. 30, 2020, at 1, 4.
Mafini Dosso & Didier Lebert, The Centrality of Regions in Corporate Knowledge Flows and the Implications for Smart Specialisation Strategies, 54 Reg’l Stud. 1366, 1367–68, 1374 (2019).
Jevin D. West, Eigenfactor: Ranking and Mapping Scientific Knowledge 11–13 (2010) (Ph.D. dissertation, University of Washington) (on file with author).
See Saikou Y. Diallo et al., Identifying Key Papers Within a Journal Via Network Centrality Measures, 107 Scientometrics 1005, 1008 (2016).
Torrance & West, supra note 28, at 485.
Kevin A. Bryan, Yasin Ozcan & Bhaven Sampat, In-Text Patent Citations: A User’s Guide, Rsch. Pol’y, May 2020, at 1, 1.
David S. Abrams & Bhaven N. Sampat, Drug Patent Citations and Value 3–4 (Apr. 2025) (unpublished manuscript) (on file with Haverford College); Kyle Higham, Gaétan de Rassenfosse & Adam B. Jaffe, Patent Quality: Towards a Systematic Framework for Analysis and Measurement, 50 Rsch. Pol’y, no. 4, 2021, at 1, 4.
Torrance & West, supra note 28, at 481.
Manuel Trajtenberg, A Penny for Your Quotes: Patent Citations and the Value of Innovations, 21 RAND J. Econ. 172, 181–85 (1990).
Torrance & West, supra note 28, at 482.
W. Michael Schuster & Kristen Green Valentine, An Empirical Analysis of Patent Citation Relevance and Applicant Strategy, 59 Am. Bus. L.J. 231, 266–73 (2022); Alan C. Marco & Richard D. Miller, Patent Value, Uncertainty, and Standard Declaration: Implications from Patent Litigation 4 (July 2024) (unpublished manuscript), https://wwws.law.northwestern.edu/research-faculty/clbe/events/standardization/documents/marco_miller_litigation_dynamic.pdf [https://perma.cc/GSX8-2632].
See Aristodemou & Tietze, supra note 86, at 40.
Torrance & West, supra note 28, at 484–85.
Id. at 472, 479, 482–85, 485 n.81, 487–89.
Id. at 485, 487–88.
See id. at 472–75.
Zewen Hu, Xiji Zhou & Angela Lin, Evaluation and Identification of Potential High-Value Patents in the Field of Integrated Circuited Using a Multidimensional Patent Indicators Pre-Screening Strategy and Machine Learning Approaches, J. Informetrics, May 2023, at 1, 3–5.
Id. at 4.
See Higham, Rassenfosse & Jaffe, supra note 95, at 5, 31.
Jung-Tae Hwang, Byung-Keun Kim & Eui-Seob Jeong, Patent Value and Survival of Patents, J. Open Innovation: Tech., Mkt. & Complexity, June 2021, at 1, 4–5.
The Authors thank PatentVector LLC for its generous willingness to donate data for this study. More information about PatentVector may be found at https://patentvector.com/ [https://perma.cc/6BF5-7S3W]. The data used in the following analysis and provided by PatentVector LLC can be found on file with the Authors.
With credit due to Mark Twain, who is reputed to have remarked, in a letter to Frank Marshall White of the New York Journal, in response to rumors of his demise, “[t]he report of my death was an exaggeration.” See Michael Wagar, Publisher’s Note: Rumors of the Chronicle’s Death Are Exaggerated, Chronicle (May 4, 2018, at 19:27 CT), https://www.chronline.com/stories/publishers-note-rumors-of-the-chronicles-death-are-exaggerated,17607 [https://perma.cc/TDR4-PYGL].
Apr. 15, 1994, Marrakesh Agreement Establishing the World Trade Organization, Annex 1C, 108 Stat. 4809, 1869 U.N.T.S. 299; WTO Legal Texts, World Trade Org., https://www.wto.org/english/docs_e/legal_e/legal_e.htm [https://perma.cc/UL2U-SEA8] (last visited Sep. 2, 2025).
See Bryan Mercurio & Pratyush Nath Upreti, Patent Term Extension and Test Data Protection Obligations: Identifying the Gap in Policy, Research, and Practice of Implementing Free Trade Agreements, J.L. & Biosciences, July–Dec. 2023, at 1, 4.
In the worldwide patent network calculated by PatentVector, there is a “Cluster 7”, which is, in reality, a grab-bag of miscellaneous technologies, none of which belong in clusters 1 to 6. In addition, despite the simple titles of the technology clusters, each of them encompasses not only the technology called out by its short name but also allied technologies.
Katherine Quinn et al., Introducing CSET’s Patent Clusters, Ctr. for Sec. & Emerging Tech. (July 28, 2025), https://cset.georgetown.edu/publication/introducing-csets-patent-clusters/ [https://perma.cc/MG2F-NJM4].
Torrance & West, supra note 28, at 472, 484.
See Kuang-Chang Chai et al., supra note 89, at 1,5.
See Francesco Tudisco & Desmond J. Higham, Node and Edge Nonlinear Eigenvector Centrality for Hypergraphs, Commc’ns Physics, Sep. 2, 2021, at 1, 2.
Agarwal et al., supra note 87, at 302, 307.
Bronwyn H. Hall, Business Method Patents, Innovation, and Policy 3–5 (Nat’l Bureau of Econ. Rsch., Working Paper No. 9717, 2003), https://www.nber.org/papers/w9717 [https://perma.cc/2CK8-ANWN].
Adam Novak, Semiconductor Topography IP Rights: Is There Possibility for Revival? (2022) (LLM thesis, Lund University), https://lup.lub.lu.se/luur/download?func=downloadFile&recordOId=9104878&fileOId=9108044 [https://perma.cc/UTH3-2ARL].
See Ariel Dora Stern, Innovation Under Regulatory Uncertainty: Evidence from Medical Technology, 145 J. Pub. Econ. 181, 194 (2016); Harold Thimbleby, Technology and the Future of Healthcare, 2 J. Pub. Health Rsch. 160, 162 (2013).
Atkinson, supra note 79.
As noted above, importance data after about 2020 should not be relied upon unduly, given the short time in which patent citations could possibly have been accrued.
Note that different jurisdictions have developed different, and sometimes conflicting, rules regarding patentability for software-related inventions. Contrast Alice Corp. v. CLS Bank Int’l, 573 U.S. 208, 223 (2014) (software must improve on an already existing process to be patentable), with Brad Sherman, Computer Programs As Excluded Patentable Subject Matter, in Exclusions from Patentability and Exceptions and Limitations to Patentees’ Rights 1, 36–55 (2010) (some jurisdictions explicitly do not allow software to be patentable while others are focused on whether the software is technical).
James Bessen & Robert M. Hunt, An Empirical Look at Software Patents, 16 J. Econ. & Mgmt. Strategy 157, 160–63, 170 (2007).
Id.; see Alice Corp., 573 U.S. at 217–19, 227.
Kevin J. Hickey & Erin H. Ward, Cong. Rsch. Serv., R46679, The Role of Patents and Regulatory Exclusivities in Drug Pricing 3–5 (2024).
2024 WIPI Report, supra note 3, at 71–72; Xikai, supra note 51.
See Atkinson, supra note 79.
See supra Section II.B.
WIPO China: Harnessing IP to Drive Innovation and Global Collaboration, supra note 5.
See Development Agenda for WIPO, WIPO, https://www.wipo.int/ip-development/en/agenda/ [https://perma.cc/A42N-7RJC] (last visited Aug. 13, 2025).
2024 WIPI Report, supra note 3, at 72; see supra Part VI.
2024 WIPI Report, supra note 3, at 29.
Il Sorpasso is a famous 1962 Italian road comedy film directed by Dino Risi. Dino Risi’s ‘The Easy Life,’ Italian Comedy-Drama, Arrives, N.Y. Times (Dec. 23, 1963), https://www.nytimes.com/1963/12/23/archives/dino-risis-the-easy-life-italian-comedydrama-arrives.html [https://perma.cc/AU3J-QKCZ]. In 1987, the phrase “Il Sorpasso” was used by some in the Italian press to describe how Italy’s nominal GDP overtook that of the United Kingdom—a moment viewed with great pride by many Italians. See, e.g., William Echikson, Il Sorpasso Has Italians Riding High, Christian Sci. Monitor (May 8, 1987, at 12:05 ET), https://www.csmonitor.com/1987/0508/oital.html [https://perma.cc/7BMT-6YC2]. By the late 1990s, the economy of the United Kingdom had surpassed that of Italy once again. Larry Elliott, Italy and France ‘To Overtake UK’, Guardian (Dec. 8, 2008, at 09:03 ET), https://www.theguardian.com/business/2008/dec/08/economy-gdp-uk-italy-france [https://perma.cc/2J74-S989].
2024 WIPI Report, supra note 3, at 12, 14.
Griliches, supra note 7, at 1669–70.
See 2024 WIPI Report, supra note 3, at 17.