

- I. Introduction
- II. Background on American Carbon Emissions and Climate Science
- III. The American Environmental Regulatory Framework Applied to Climate Policies
- IV. Catalogue of Subnational Organizations and Initiatives
- V. Conclusion
I. Introduction
In a self-announced and publicly televised address, President Trump announced that the United States would withdraw from the Paris Agreement.[1] Promptly, those opposed to the withdrawal condemned the decision.[2] Coalitions of state and local governments promised to enact policies within their jurisdictions that would, in the aggregate, honor the United States’ obligations under the international agreement.[3] Business groups pledged their support as well.[4] These coalitions cannot keep this promise. State and local climate policies, as well as innovation within the private sector, are indispensable pieces in the national climate solution. However, physical and structural limitations cause the assumption of the national obligation to be impossible. In short, state and local actors cannot cut enough carbon emissions without the federal government.
A. The Paris Agreement
On April 22, 2016, the United States, along with 174 other nations, officially joined the Paris Agreement.[5] The Paris Agreement is an international accord (which is different than a treaty)[6] whose purpose is to combat global climate change.[7] The United Nations Framework Convention on Climate Change (UNFCCC) secretariat—the United Nations’ (UN) governing body committed to addressing climate change—organized the Agreement’s passage.[8] The Paris Agreement is the most comprehensive international legal framework to address climate change since the 1997 Kyoto Protocol.[9]
Though a detailed description of the Paris Agreement’s mechanics is outside the scope of this Note, a surface-level understanding is necessary.[10] Under this international accord, parties to the agreement must craft and implement nationwide climate policy goals, called nationally determined contributions (NDCs).[11] The Paris Agreement intends for the NDCs cumulatively to accomplish the Agreement’s three stated purposes: (a) to hold “the increase in global average temperature to well below 2ºC”; (b) to help nations adapt to those adverse effects of climate change that already exist; and (c) to establish “finance flows” to facilitate the development of clean energy infrastructure, especially in developing nations.[12] The first of these three goals refers to the need to reduce global greenhouse gases (GHGs) and therefore cap the increase of global annual temperatures.[13] In short, each country is supposed to propose a plan that will reduce its domestic GHGs to the greatest extent practicable. This Note focuses on the first purpose, though the last two of the Paris Agreement’s three stated purposes are certainly important.[14] Efforts to reduce GHG emissions (so-called climate “mitigation” efforts)[15] should take priority because mitigation and adaptation costs grow exponentially as they remain unaddressed.[16]
B. Policy Debate
There is much debate on which parties should bear the greatest responsibility to cut GHGs. The Obama Administration, in the American NDC, pledged to cut domestic carbon emissions by 26%–28% from 2005 levels by 2025 (an acceleration in emissions reductions in comparison to the current projected decrease: 17% from 2005 levels by 2025).[17] The Paris Agreement’s American opponents believe the Agreement places too much responsibility on the United States.[18] Why should the United States commit to a sharp reduction in GHGs and risk harmful economic repercussions when other major emitters—especially China and India—commit only to mild environmental improvements?[19] Because, the American supporters of the Paris Agreement might respond, it is impracticable to expect countries that are in different stages of economic development to adopt equally stringent controls. Also, the concern over the potential economic injury has been largely overstated.[20] Though many commentators have weighed in on this debate, this Note does not make a value judgment either way.[21] Rather, it identifies limitations on climate policies that apply to either answer. If the nation must meet the goal proposed in the American NDC, state and local policies cannot do so alone. If the climate problem can be solved incrementally, an efficient program should include a federal policy to supplement state and local initiatives.
C. Withdrawal from the Paris Agreement and the Response
On January 20, 2017, Donald Trump assumed the presidency.[22] President Trump brought into the White House his campaign promises to rein in the perceived regulatory overreach of the Obama Administration and to unencumber the straining energy industry.[23] Roughly five months after President Trump took the oath of office, he announced that the United States would withdraw from the Paris Agreement.[24] The Trump Administration, accordingly, has sought to undo or scale back most of the Obama Administration’s initiatives described in the American NDC.[25]
Many state and local governments, and the boards of many private corporations (collectively, subnational actors) condemned President Trump’s decision to withdraw from the Paris Agreement.[26] The members of the subnational climate initiatives are large in number—at the time of this Note’s publishing, they total at least 17 governors, 403 mayors, and 2,143 corporations.[27]
These organizations’ goal is to “uphold the commitments to the goals enshrined in the Paris Agreement.”[28] For the purposes of this Note, I take this goal to mean “to cut the same amount of carbon emissions as that pledged by the American NDC.”
This Note analyzes the subnational response to the American withdrawal from the Paris Agreement and asks the following question: Are subnational climate policies sufficient to fulfill America’s obligations under the Paris Agreement? Subnational climate policies are commendable and, indeed, requisite in the overall response to climate change.[29] Ultimately, however, a comprehensive climate policy is impossible without a federal solution.
D. Roadmap
In Part II, this Note provides background for the climate policy discussion. It mentions in brief the United States’ contribution to climate change and other propositions as to how America (and the rest of the international community) must address their contributions.
In Part III, this Note summarizes the American environmental regulatory framework as it pertains to GHG emissions. In doing so, it highlights potential federal solutions and notes ways in which subnational actors are limited in enacting such solutions.
Last, in Part IV, this Note analyzes the subnational policies that have been proposed or implemented. It investigates the policies of several (but not all) subnational climate initiatives and explains why they cover only a small percentage of the American climate contribution.
II. Background on American Carbon Emissions and Climate Science
Before we can discuss the efficacy of climate policies, we should first understand—at least on a cursory level—how polluters release carbon dioxide (CO2) into the air and how CO2 affects the global climate. This Part begins by reporting the areas of industry and commerce that release the most carbon emissions. It also reports the natural resources these industrial and commercial groups utilize the most. In so doing, it identifies the areas that most need emissions reductions. This Part then briefly notes how carbon dioxide affects the climate once it enters the atmosphere. In particular, this Part describes several characteristics that cause climate change to be particularly resistant to traditional environmental policy solutions.
A. Overview of the Sources of American Carbon Emissions
A simple way to measure the success of a climate mitigation policy is to measure the reduction in GHGs and, in particular, carbon emissions.[30] Before we can measure emissions reductions, we should identify the sources that produce emissions. Most carbon emissions (93.5%) in the United States come from the burning of fossil fuels.[31] Two economic sectors account for more emissions than any others: power generation and transportation.[32] A smaller percentage of emissions come from the industrial, residential, and commercial sectors.[33] Finally, a small portion of carbon emissions come from the U.S. territories.[34] Figure 1,[35] below, shows the percentage of United States carbon emissions that result from the burning of fossil fuels according to sector.

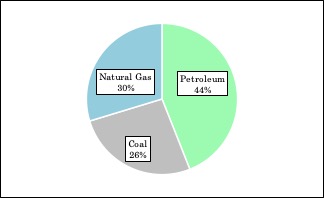
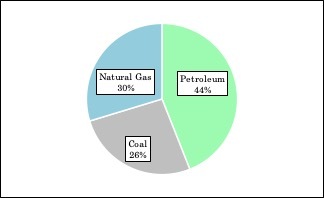
To design effective policy solutions, we should also understand which natural resources account for the most CO2 emissions. Petroleum accounts for the largest share (44%).[36] Natural gas (29.7%) follows petroleum, and coal (26.3%) accounts for the smallest share.
The economic sectors use petroleum, natural gas, and coal unequally. Petroleum emissions result almost exclusively from the transportation sector. The vast majority of coal emissions come from the power generation sector. Natural gas emissions, by contrast, are spread throughout various sectors. Figures 2[37] and 3,[38] below, show the contribution of petroleum, natural gas, and coal to American carbon emissions and their use in the different sectors.
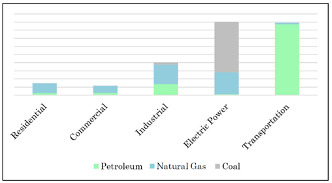
These statistics support the following conclusions. First, the transportation and the power generation sectors warrant the most regulatory attention because they account for the two largest shares of American emissions. Policy initiatives that do not include transportation and power generation sector regulations are likely to be inefficient as to emissions reductions. Second, there are intersections of priority. For example, an efficient climate policy should address power generation sector emissions that result from burning coal because this process accounts for such a large percentage (68.6%) of emissions within this economic sector.[39] In the transportation sector, an efficient climate policy will both require vehicles to burn petroleum more efficiently and encourage the expansion of vehicles that do not rely exclusively on gasoline. State and local climate policies are limited in part because they struggle to address several economic sectors that require the most attention.
B. Climate Change’s Physical and Structural Resistance to Subnational Policies
Climate change is uniquely resistant to state and local initiatives.[40] An understanding of these limitations is essential to implement policy solutions that work with, rather than against, the economic and physical nature of the problem.
1. The Cost of Climate Change Related Effects Is Imprecise.
We can quantify the human and financial costs of most environmental problems. Consider the regulation of ozone emissions. In harmful quantities, ozone “damages lung tissue, reduces lung function, and sensitizes the lungs to other irritants.”[41] The Environmental Protection Agency (EPA) regulates the emission of ozone by setting a so-called eight-hour standard.[42] Where the eight-hour concentration of ozone in a region exceeds the standard, there are corresponding health consequences.[43] Logically, we can determine the cost of internalizing these health consequences. Oversimplified, an increase in ozone will cause more persons to develop lung diseases and the region will lose money in lost employment and medical expenses.
Climate change is more difficult to quantify because short-term effects are nearly impossible to predict. In the long run, climate change will, among other effects, cause more severe storms, reduce the global water supply, and reduce the productivity of agriculture.[44] Though it may be possible to quantify the long-term cost of responding to climate change, the cost of incremental pollution is unknown.[45] Climate change, therefore, is more difficult to internalize than other environmental problems because the scope of its harm is uncertain. As a result, state and local governments are uniquely unable to weigh costs and benefits.
2. Regional Actions, Regional Benefits, and the Traditional Collective Action Problem.
As to climate change, state and local policies do not have state and local effects. There are some exceptions to this general rule that I do not discuss here.[46] As to ozone pollution, a state or city can regulate the emission of ozone within its jurisdiction and reduce the associated health effects.[47] A regional decrease in carbon emissions, however, does not cause a regional climate improvement.[48] A state that reduces ozone concentration by 50% can expect to see a 50% reduction in ozone-related health conditions (these numbers are purely demonstrative). By contrast, a state that reduces carbon emissions by 50% cannot expect a 50% reduction in negative effects related to climate change.
Climate change’s physical properties exacerbate what is already a race to the bottom.[49] Consider the regulation of sulfur dioxide (SO2). When power plants burn coal, the process produces SO2. Virginia, wanting to protect its citizens from the harmful effects of SO2, might implement regulations that limit SO2 emissions. But if these limitations become too financially restrictive, the energy producer may move to a more business-friendly state like West Virginia. West Virginia’s policy forces Virginia to choose between cleaner air or cheaper energy.[50]
Climate change presents the same problem, but worse. The areas that are most susceptible to the negative effects of climate change—coastland, for example—may not always correspond to the regions that most contribute to American emissions.[51] Coastal states and other similarly disadvantaged states, therefore, have little incentive to enact strong emissions regulations if they cannot count on the rest of the nation to do so. In addition, because state economies begin from different “starting points,” a state that enacts strong climate policies does not always account for less carbon emissions.[52] In short, state and local governments cannot guarantee climate improvements through regulation because their actions will not directly affect their jurisdictions and the actions of other states are unclear.
C. Policy Implications
The limits above pose the following question: If traditional environmental responses are ineffective, what sort of solution is required? The general consensus (though there are dissenters) among many scientific bodies—including the parties to the Paris Agreement—is that capping the rise of average annual temperatures at 2ºC above pre-industrial levels will prevent the worst of climate change.[53] Bodies of science will continue to study climate change’s long-term effects and the associated costs to confirm or adjust this target.[54]
To obtain the 2ºC goal, many scientists assert that a 50%–80% reduction in global carbon emissions from 1990 levels by 2050 is required, with increased reductions thereafter.[55] The emission reductions estimates are steeper for more developed nations because they release more CO2.[56] The Obama Administration, in pursuit of this global target, pledged to cut American carbon emissions by 26%–28% from 2005 levels by 2025 (an acceleration of the already projected 17% reduction from 2005 levels by 2020).[57] The Administration asserted this pace will lead the United States to the recommended 80% reduction by 2050.[58]
Is it advisable to pursue a strategy of emissions reductions like the one described by the American NDC? Perhaps. That question is fiercely debated by many and outside the scope of this Note. If we take the words of the various subnational actors at face value, these governors, mayors, and business leaders intend to pursue this emissions reduction target in the absence of federal support.[59] Is this pursuit feasible? No. Though state and local policies are a necessary component of the climate response, subnational actors do not possess the power to achieve a 26%–28% reduction.
III. The American Environmental Regulatory Framework Applied to Climate Policies
To review, climate change’s physical and economic properties limit the effectiveness of state and local climate policies. This Part explains a third limit: American environmental law. In general, federal environmental law sets national rules and leaves the state governments to fill in the gaps.[60] National rules are important because they prevent the race to the bottom. With climate change regulations, state and local governments rely especially heavily on the federal government.[61] This Part explains the methods available to the federal government to regulate carbon emissions and how the federal methods limit the effectiveness of state and local policies. For organization, this Part addresses each major economic sector in turn: power generation, industrial, transportation, commercial, and residential.
A. The Power Generation Sector
It is pivotal to reduce carbon emissions from the power generation sector because it accounts for 36% of American emissions.[62] Likewise, it is essential to reduce emissions from the stationary combustion of coal and natural gas because these operations account for roughly 98% of the power generation sector carbon emissions.[63] This Section focuses only on the regulation of these processes because stationary combustion accounts for such a large share of power generation sector emissions.
The Clean Air Act regulates carbon emissions from stationary sources through federal permitting programs called the Prevention of Signification Deterioration (PSD) and Title V.[64] PSD is a construction permitting process. An operator who wishes to construct a new facility must “analyze the potential impact on ambient air quality of emissions” from the new facility.[65] To receive a construction permit, the operator must show that it will comply with technology requirements.[66] Title V is an operating permitting process. To receive an operating permit, the operator must demonstrate that it complies with all applicable Clean Air Act regulations.[67] PSD and Title V apply to most stationary sources.[68]
PSD and Title V limit air emissions by imposing technology requirements which reflect the best available control technology (BACT).[69] The trouble with climate change, however, is that “there are not currently cost-effective, widely commercialized end-of-pipe emission control technologies for CO2.”[70] For this reason, the EPA’s guidance on establishing BACT for GHGs encourages the adoption of “energy efficiency strategies,” rather than requiring the installation of technology that would sharply reduce carbon emissions.[71] Thus, PSD and Title V currently cannot substantially limit the release of carbon emissions.
In addition to PSD and Title V, the federal government might be able to regulate carbon emissions through a program called New Source Performance Standards (NSPS).[72] NSPS imposes emissions standards for categories of stationary sources. President Obama sought to use NSPS as the base of his Clean Power Plan. Under the plan, the EPA set the NSPS for certain newly constructed power plants at 1,400 lbs. CO2/MWh.[73] Both new and existing power plans were required to install costly new control technology to comply.[74] The legality of the Clean Power Plan has been debated but the issue is moot for now because President Trump replaced the program with the Affordable Clean Energy Rule.[75]
The role of states and other subnational organizations in regulating carbon emissions from the power generation sector is simultaneously integral and limited. Integral because under the Clean Air Act, the states “have the primary responsibility” for implementing the standards established by the federal government.[76] States must submit State Implementation Plans (SIPs) that explain how they will meet federal obligations. State governments therefore can exert great influence on the regulation of carbon emissions in the efficient implementation of federal standards. States are, of course, free to involve local governments and business in their regulatory schemes.
However, several factors limit the effectiveness of state and local policies. First, state and local governments have less resources than the federal government. The EPA’s budget in 2018 was $5.655 billion whereas the Texas Commission on Environmental Quality’s (TCEQ) budget for the same year was $374.2 million.[77] Thus, the federal government can hire more prosecutors to enforce its policies, can spend more money to research policy, and generally has more capacity to regulate than do state governments. This difference is clearly not limited to climate policies. Second, state and local governments face a strong collective action problem when they choose to regulate above the federal requirements. If a state or local government implements stringent carbon regulations, they run the risk that the affected companies will reduce operations or leave altogether.[78] Though cleaner methods of energy production continue to improve, states and cities may continue to rely on traditional energy generation because it produces cheaper energy and more of it.[79]
Despite these limits, some state and local governments have enacted supplementary regulations. Oregon, Washington, and California each utilize some form of direct carbon regulation within the power generation sector.[80] Nonetheless, state and local governments struggle to uniformly regulate power generation sector emissions because it cannot be expected that every state will choose to regulate carbon emissions as these three states have. Without uniformity, we are left with the same race to the bottom.
PSD, Title V, and NSPS are not the only ways to address carbon emissions from the power generator sector. Congress could pass a cap-and-trade program for carbon emissions like the one the Clean Air Act utilizes for SO2 or implement a carbon tax.[81] It could also encourage the development of economical renewable energy.[82] Whatever the solution, it is clear that a federal remedy is necessary. Only federal remedies can avoid the collective action problem raised by purely state and local solutions.
B. The Industrial Sector
The industrial sector is composed of many independent subsectors. Whereas 98% of carbon emissions from the power generation sector come from coal and natural gas power plants, carbon emissions from the industrial sector come from the oil and gas, manufacturing, agriculture, mining, and construction industries.[83] These subsectors release carbon emissions by their ordinary use of electricity, their on-site combustion of fossil fuels to generate “electricity [or other] useful thermal output,” and as a byproduct of industrial processes such as the CO2 released by cement manufacturing or the CH4 emitted at waste sites.[84]
The Clean Air Act regulates the industrial sector similarly to the power generation sector. PSD, Title V, and NSPS regulate the constituent facilities and technologies employed at those facilities.[85] For example, NSPS regulations require the installation of emissions control technology at crude oil and natural gas production facilities.[86] Because industrial sector regulations are similar to power generation sector regulations, state and local industrial regulations are similarly limited. Industry may reduce operations or leave the region in response to laws that require sharp decreases in emissions.[87] To address carbon emissions from the industrial sector, the federal government could implement industry-specific technology requirements.[88] Emissions based programs—like cap-and-trade—would also affect the industrial sector.[89]
C. The Transportation Sector
The federal government is the primary regulator of mobile source carbon emissions.[90] The EPA sets emissions standards under Title II of the Clean Air Act, and the National Highway Traffic Safety Administration (NHTSA) sets fuel economy standards under the Energy Policy and Conservation Act (EPCA).[91] Emissions standards control the level of pollutants released into the air whereas fuel economy standards promote efficient use of fuel.[92] To manufacture or market automobiles in the United States, businesses must show that the vehicles meet EPA and NHTSA’s requirements.[93]
By design, state and local governments are mostly uninvolved in mobile source regulation. The Clean Air Act specifically prohibits states from adopting individual fuel emissions standards.[94] By virtue of its first-in-time fuel economy program, California may receive special waivers from this prohibition. Other states may adopt California’s standards.[95] But the EPA may revoke these waivers if it finds that the conditions that allowed the waiver are no longer present.[96] Indeed, President Trump’s EPA has withdrawn the waiver for California’s 2013 “Advanced Clean Car” regulations.[97]
This legal framework shows that states do not have meaningful methods of regulating mobile source carbon emissions. States may join California’s more stringent standard, but this waiver is subject to revocation. At present, fourteen states have adopted California’s policy either in whole or in part.[98] As of 2017, these states account for 31.6% of American transportation sector consumption.[99]
If the United States is to reduce transportation sector emissions, Congress must enact a federal policy because state and local policies are limited. One example is President Obama’s national fuel efficiency policy.[100] Under this policy, the EPA and NHTSA jointly issued regulations increasing emissions and fuel economy standards on passenger vehicles and light trucks.[101] The EPA projected the plan to reduce GHG emissions by 2 billion metric tons over the lifetime of the vehicles affected.[102] Under the Trump Administration, the EPA and NHTSA replaced president Obama’s policy with the less stringent Safer Affordable Fuel-Efficient (SAFE) Vehicles Rule.[103] The primary alternative to altering fuel economy requirements is encouraging the development of public transit infrastructure and low-emission vehicles.[104]
D. The Commercial and Residential Sectors
The commercial and residential sectors comprise “service-providing facilities . . . [for] private and public organizations and businesses” and private residential homes.[105] An estimated 69% (residential) and 73% (commercial) of carbon emissions come from the use of electricity for “lighting, heating, air conditioning, and operating appliances.”[106] To limit carbon emissions, the federal Energy Policy Act and Energy Independence and Security Act encourages the efficient use of energy within commercial and residential buildings.[107]
Subnational actors can effectively reduce commercial and residential sector emissions.[108] State and local actors have more personal knowledge of the commercial and residential compositions within their jurisdictions. Accordingly, these actors can more effectively organize the implementation of new buildings standards and other efficiency measures.[109]
E. Policy Implications
American environmental law limits the effectiveness of state and local policies to reduce carbon emissions. These limits are especially strong in the industrial and transportation sectors. These three sectors account for roughly 88% of American carbon emissions.[110] Thus, federal reforms are the key to a comprehensive climate change policy. Part IV of this Note reports the policies that state and local governments and private business have enacted. In so doing, it identifies the strengths and weaknesses of these efforts sector by sector. Despite their many strengths, subnational policies cannot address the American component of climate change on their own.
IV. Catalogue of Subnational Organizations and Initiatives
Many Americans have formed subnational climate policy groups because they believe climate change to be an important public problem. Some climate groups aim to address a specific policy. For example, the Regional Greenhouse Gas Initiative (RGGI) implemented a CO2 cap‑and-trade system including nine Northeastern states.[111] Some climate groups focus on general advocacy rather than address a particular issue. The U.S. Climate Alliance is a group of states—led by their governors—that advocate for climate policies on the state level.[112] The Climate Mayors is a group of mayors that advocate for and implement similar climate policies at the city level.[113] The We Are Still In initiative is a group of states, counties, cities, and corporations[114] whose goals are to effect climate policy and share policy strategy.[115]
In general, these initiatives are composed of similar members. The strongest enclaves for climate policies are the Northeast states,[116] and California, Oregon, Washington, and Colorado (collectively, the climate states).[117] The effects of state and local climate policies, though strong in these areas, is therefore limited to the jurisdictions with enough popular support to enact the policies described below.
This Part catalogues many subnational climate policies by order of economic sector. It evaluates which initiatives are most efficacious and flags major impediments. Though some subnational policies should be expanded, this Part supports the Note’s overall conclusion: these state and local policies standing alone are insufficient to address America’s obligation under the Paris Agreement.
A. The Power Generation Sector
Some states have enacted comprehensive power generation sector regulations. Consider California’s cap-and-trade system. In California, carbon emissions from energy generation have fallen by 34.6% since 2000 and 23.4% since 2013.[118] Other factors likely contributed to this figure, like industry’s shift away from coal and to natural gas.[119] Nevertheless, it is clear that subnational policies can affect power generation sector carbon emissions.
However, states and cities face potential economic backlash when they regulate CO2 independent of the federal government.[120] California is one of only a few states to install a statewide program, so we are thus left with the same race to the bottom as before.
States can in part solve the collective action problem by entering into regional coalitions. Of the several regional organizations in the United States, only the RGGI obliges its members to reduce carbon emissions.[121] The benefits of collective action are obvious: compared to the individual, the group can cover more jurisdictions, control more emissions, and prevent industry from turning to nearby, less regulated states.[122]
Though a region may be better than a state, it is still worse than a country. A region controls only a fraction of the nation’s carbon emissions. Indeed, the RGGI covers only 4.02% of energy generation sector carbon emissions.[123] In addition, membership in the RGGI is voluntary; New Jersey, originally a member, left the organization in 2011.[124] Though a regional cap-and-trade program is an improvement on a statewide program, it ultimately suffers from the same underlying problem: a region cannot compel other regions to participate.[125]
Subnational actors also invest in and increase their use of renewable energy.[126] Investment has two primary effects. First, it builds renewable capacity.[127] If states and cities seek to cut back on their energy purchases from traditional power plants, there must be energy producers to fill the gap.[128] Second, and related, investment improves the market for renewable energy.[129] As the supply of renewable energy grows, its cost falls.[130]
Investment in renewable energy generation only gets us so far, though. For the foreseeable future, coal and natural gas will continue to constitute the majority of America’s power generation.[131] This limit and the others discussed in this section support the priority of federal power generation sector regulation. State and local policies make meaningful contributions but are insufficient by themselves.
B. The Industrial Sector
Industrial regulations, like power generation regulations can have meaningful impacts within a locale. State and local governments are well placed to install industrial sector regulations because they know the composition of industry within their jurisdictions. Several states have implemented industrial efficiency programs; these initiatives require industry to upgrade their facilities and appliances to reduce overall energy consumption.[132] Similarly, some cities require industry to report and reduce their energy use to identify areas for improvement.[133]
Nationwide, however, the impact of subnational industrial sector carbon emissions regulations is limited because only some jurisdictions will adopt them. Those states or cities that enact industrial controls are subject to the risk that industry might decrease production within the regulated forum and increase operations in a less regulated place.[134] Many subnational industrial regulations have proven successful. But without the federal government, states, cities, and private business can only control a fraction of the 16% of carbon emissions for which the industrial sector accounts.[135]
C. The Transportation Sector
Subnational actors struggle to control transportation sector carbon emissions. States can adopt California’s more stringent fuel economy standards, but they can be challenged by an opposing presidential administration. And only thirteen states have adopted the standard.[136]
Many climate initiatives focus on transportation efficiency.[137] These initiatives include but are not limited to: (a) incentivizing the expansion of electric or low‑emission vehicles in the public and private sector; (b) expanding public transportation; and (c) partnering with local business owners to reduce transportation volume.[138] These initiatives, however, are fighting against projections of vehicle demand. From 2017 to 2050, rising income and population are projected to increase the numbers of miles travelled by light-duty vehicles (everyday cars) by 18%.[139] Over the same time period, increased economic activity is projected to increase the number of miles traveled by heavy trucks by 50% and freight rail by 27%.[140]
These numbers tell us that transportation will grow substantially over the next several decades despite efforts to increase efficiency. If we cannot reduce the overall volume of transportation, the appropriate climate response is to improve the efficiency of the vehicles that are doing the transporting. States can enact their own fuel economy standards, but this alternative is limited.[141] Cities and other local governments can create efficient transportation systems, but a large piece of the transportation sector puzzle will be missing without federal regulation of the national fuel standards.
D. The Commercial and Residential Sectors
State and local policies that control commercial and residential sectors carbon emissions focus on reducing the energy consumption of commercial and residential buildings.[142] This approach is appropriate because roughly 70% of commercial and residential sector carbon emissions come from electricity use.[143] Subnational actors are well placed to implement commercial and residential controls because they require specific knowledge of the local businesses and residences.[144] Seventeen cities and hundreds of businesses within the Climate Mayors and We Are Still In enacted commercial and residential sector policies.[145]
Efficient commercial and residential sector regulations are not enough to cut American carbon emissions on par with the goal in the Paris Agreement. Subnational actors exceed at organizing community-specific improvements like those required for the commercial and residential sectors. But those sectors account for only 11% of American carbon emissions.[146] Though subnational policies are especially impactful in these sectors, the impact compared against the sum of American emissions is narrow.
E. Summary of Subnational Policies
State and local climate policies are substantially limited. In the power generation sector, some states avoid the race to the bottom by creating regional organizations. But these organizations do not include many of the states that produce the most CO2 emissions.[147] Transportation sector initiatives are limited by the federal prohibition against state-specific fuel economy standards. And commercial and residential sector policies account for a small percentage of American carbon emissions. Despite their many creative and praiseworthy initiatives, state and local climate policies are substantially limited if unsupported by a federal program.
V. Conclusion
Many scientists, politicians, and other commentators have discussed the appropriate response to climate change.[148] The precise path forward is unclear. Nonetheless, we should bear in mind the limits of state and local climate policies as we craft policy alternatives.
In theory, state and local government is better suited to implement small-scale programs that are tailored to local communities.[149] Statewide cap-and-trade programs, citywide initiatives to reduce transportation-sector emissions, and efforts by businesses to increase the energy efficiency of their buildings are all perfect examples of the traditional role of state and local government. However, climate science, economic interests, and our federal system of government limit the effectiveness of subnational policies. Under the current system of American environmental law, the federal government simply has the power to control a much larger share of American carbon emissions than state and local governments.
This conclusion applies to multiple policy approaches. On one hand, it may be necessary to pursue an aggressive reduction in carbon emissions over the next thirty years to avoid the onset of severely debilitating natural consequences. On the other, it may be optimal to pursue incremental adjustments to preserve the competitiveness of the American economy and ensure the cooperation of China, India, and other countries that emit large volumes of greenhouse gas emissions. In either case, a climate policy that centers on state and local initiatives and ignores federal programs will be inefficient and limited. Are the actions of the states, cities, and businesses that pursue climate policies impactful and praiseworthy? Yes. Can, as these organizations claim, state and local climate policies cut carbon emissions on par with the goal laid out in the United States’ NDC? No.
Jack Buckley DiSorbo
See Michael D. Shear, Trump Abandoning Global Climate Accord, N.Y. Times, June 2, 2017, at A1; President Donald J. Trump (@realDonaldTrump), Twitter (May 31, 2017, 8:05 PM), https://twitter.com/realdonaldtrump/status/870083798981111808?lang=en [https://perma.cc/Z7VA-EZNK] (“I will be announcing my decision on Paris Accord, Thursday at 3:00 P.M. The White House Rose Garden. MAKE AMERICA GREAT AGAIN!”).
See, e.g., Chuck Schumer (@SenSchumer), Twitter (June 1, 2017, 2:50 PM), https://twitter.com/senschumer/status/870366985292587011 [https://perma.cc/D7LP-CFFG] (sharing a satirical article with the headline “Trump to Earth: Drop Dead”); Joe Biden (@JoeBiden), Twitter (June 1, 2017, 3:21 PM), https://twitter.com/joebiden/status/870374738597564416?lang=en [https://perma.cc/4KFX-RNC5] (“We’re already feeling impacts of climate change. Exiting #ParisAgreement imperils US security and our ability to own the clean energy future[.]”).
See infra notes 26–28 and accompanying text.
See infra note 27 and accompanying text.
Edith M. Lederer & Cara Anna, 175 Countries, Including U.S., Sign Paris Deal on Climate Change, Hous. Chron. (Apr. 23, 2016), https://www.houstonchronicle.com/news/nation-world/world/article/175-countries-including-U-S-sign-Paris-deal-on-7304518.php [https://perma.cc/7XLT-WNZ8].
See Daniel Bodansky & Peter Spiro, Executive Agreements+, 49 Vand. J. Transnat’l L. 885, 917 (2016). The Paris Agreement is “the latest installment of the UN climate change regime.” Id. Though, through Senate ratification, the United States joined the governing body committed to addressing climate change (the United Nations Framework Committee on Climate Change), not all subsequent agreements organized by the Framework are formal Article II treaties. Id. Some agreements—like the Paris Agreement—require only executive approval. Id. at 917–19.
Joanna Depledge, The Legal and Policy Framework of the United Nations Climate Change Regime, in The Paris Agreement on Climate Change: Analysis and Commentary 27, 27 (Daniel Klein et al. eds., 2017).
See About the Secretariat, UNFCCC, https://unfccc.int/about-us/about-the-secretariat [https://perma.cc/3XBC-E7H7] (last visited Apr. 2, 2020). For background on the UNFCCC, please see Depledge, supra note 7, at 28–32.
See Depledge, supra note 7, at 32–37; see also Kyle W. Danish, The International Regime, in Global Climate Change and U.S. Law 31, 36 (Michael B. Gerrard ed., 2007) (“The Kyoto Protocol [was] the current apogee of international efforts to address global climate change and a significant milestone in the evolution of international environmental law generally.”). For a summary of the Kyoto Protocol’s operational mechanics, see generally id. at 36–52.
See The Paris Agreement on Climate Change: Analysis and Commentary, supra note 7, at 107–374. For such a description, see generally Ralphe Bodle et al., The Paris Agreement: Analysis, Assessment and Outlook, 10 Carbon & Climate L. Rev. 5 (2016) (providing a comprehensive overview of the Paris Agreement).
See Paris Agreement to The United Nations Framework Convention on Climate Change art. 3, Dec. 12, 2015, T.I.A.S. No. 16-1104 [hereinafter Paris Agreement].
See id. art. 2; Bodle et al., supra note 10, at 6–7, 11–12.
See Bodle et al., supra note 10, at 7–9. Since 1901, average global temperatures have risen by approximately 0.7–0.9ºC (1.3–1.6ºF). The rate of growth of temperatures since 1975 to present (1.5–1.8ºC or 2.7–3.2ºF) is double that of the mean growth rate since 1901. See Rebecca Lindsey & LuAnn Dahlman, Climate Change: Global Temperature, Climate.gov (Aug. 1, 2018), https://www.climate.gov/news-features/understanding-climate/climate-change-global-temperature [https://perma.cc/C9XR-6L5X]; Global Temperature, NASA, https://climate.nasa.gov/vital-signs/global-temperature/ [https://perma.cc/WZS3-NUJV] (last updated Apr. 17, 2020).
To combat climate change, actions in addition to GHG reductions are necessary. For example, there are many parties that have already been adversely affected by climate change to a serious extent. Efforts to help these parties adjust to the realities of their new environments are called “adaptation” and “climate resilience” efforts. See generally Victor B. Flatt, Adapting Laws for a Changing World: A Systemic Approach to Climate Change Adaptation, 64 Fla. L. Rev. 269 (2012); Janet E. Milne, Storms Ahead: Climate Change Adaptation Calls for Resilient Funding, 39 Vt. L. Rev. 819 (2015).
See, e.g., Mitigation, UN Env’t Programme, https://www.unenvironment.org/explore-topics/climate-change/what-we-do/mitigation [https://perma.cc/2PFF-TVGT] (last visited Apr. 2, 2020) (“Climate Change Mitigation refers to efforts to reduce or prevent emission of greenhouse gases.”).
See Michael B. Gerrard, Introduction and Overview, in Global Climate Change and U.S. Law, supra note 9, at 1, 13–14.
See NDC Registry, UNFCCC, https://www4.unfccc.int/sites/NDCStaging/Pages/All.aspx [https://perma.cc/D434-VMEC] (click on “UNITED STATES OF AMERICA FIRST NDC”; then follow “USA First NDC” hyperlink) (last visited Apr. 2, 2020).
See, e.g., President Donald J. Trump, Statement by President Trump on the Paris Climate Accord (June 1, 2017) (transcript available at https://www.whitehouse.gov/briefings-statements/statement-president-trump-paris-climate-accord/ [https://perma.cc/JX5A-72PG]); see also Press Release, The White House, Text of Letter from the President to Senators Hagel, Helms, Craig, and Roberts (Mar. 13, 2001), https://georgewbush-whitehouse.archives.gov/news/releases/2001/03/20010314.html [https://perma.cc/X6PA-EGKQ] (summarizing George W. Bush’s reasons for declining to join the Kyoto Protocol).
China committed not to a GHG reduction in absolute terms but rather to capping its maximum emission of GHGs by 2030. See NDC Registry, supra note 17 (click on “CHINA FIRST NDC”; then follow “China First NDC” hyperlink); see also China, Climate Action Tracker (Nov. 6, 2017), https://climateactiontracker.org/media/documents/2018/4/CAT_2017-11-06_CountryAssessment_China.pdf [https://perma.cc/H2V9-Z782]. India committed to a GHG reduction according to GDP intensity (this is called “emission intensity” or “carbon intensity”). See NDC Registry, supra note 17 (click on “INDIA FIRST NDC”; then follow “India First NDC” hyperlink). This means that GHG reductions are measured relative to growth in GDP. Thus, continued growth in GDP reduces the absolute GHG reduction required. See Kevin A. Baumert et al., World Res. Inst., Navigating the Numbers: Greenhouse Gas Data and International Climate Policy 25, 27–28 (2005), http://pdf.wri.org/navigating_numbers.pdf [https://perma.cc/R4CD-Z9HW].
E.g., President Barack Obama, Statement by the President on the Paris Climate Agreement (Dec. 12, 2015) (transcript available at https://obamawhitehouse.archives.gov/the-press-office/2015/12/12/statement-president-paris-climate-agreement [https://perma.cc/6JUP-ZU4Y]).
See generally Terry L. Anderson & Donald R. Leal, Free Market Environmentalism Revised Edition 160 (2001); Thomas Gale Moore, Climate of Fear 142–45 (1998); Richard L. Ottinger et al., Pace Univ. Ctr. for Envtl. Legal Stud., Environmental Costs of Electricity 347–507 (1990) (summarizing the costs to industry of climate regulations according to the resource regulated); Roy W. Spencer, How Do We Know the Temperature of the Earth?, in Earth Report 2000: Revisiting the True State of the Planet 23–40 (Ronald Bailey ed., 2000); Daniel C. Etsy, Good Governance at the Supernational Scale: Globalizing Administrative Law, 115 Yale L.J. 1490 (2006); Richard J. Lazarus, Super Wicked Problems and Climate Change: Restraining the Present to Liberate the Future, 94 Cornell L. Rev. 1153 (2009); Frédéric Gilles Sourgens, Climate Commons Law: The Transformative Force of the Paris Agreement, 50 N.Y.U. J. Int’l L. & Pol. 885 (2018); Barton H. Thompson, Jr., Tragically Difficult: The Obstacles to Governing the Commons, 30 Envtl. L. 241 (2000).
Kevin Diaz & Bill Lambrecht, Trump Vows New Era of ‘America First’: Echoes of Campaign Rallies Take Center Stage, Hous. Chron., Jan. 21, 2017, at A1.
See, e.g., Ashley Parker & Coral Davenport, Trump Urges More Drilling and Few Rules, N.Y. Times, May 26, 2016, at A1.
See Shear, supra note 1. Though it appears that the President has the power to unilaterally withdraw from the Paris Agreement, the procedure for doing so is more complicated than notification and withdrawal. See Curtis A. Bradley & Jack L. Goldsmith, Presidential Control over International Law, 131 Harv. L. Rev. 1201, 1225, 1248–52 (2018); cf. Harold Hongju Koh, Presidential Power to Terminate International Agreements, 128 Yale L.J.F. 432, 467–72 (2018) (highlighting the complicated withdrawal procedure but questioning the uniformity of opinion that the President may unilaterally withdraw from the Paris Agreement).
See, e.g., Repeal of the Clean Power Plan; Emission Guidelines for Greenhouse Gas Emissions from Electricity Utility Generating Units; Revisions to Emissions Guidelines Implementing Regulations, 84 Fed. Reg. 32,520 (proposed July 8, 2019) (to be codified at 40 C.F.R. pt. 60) (replacing the Clean Power Plan).
See, e.g., Statement from the Climate Mayors in Response to President Trump’s Withdrawal from the Paris Climate Agreement, Climate Mayors, http://climatemayors.org/actions/paris-climate-agreement/ [https://perma.cc/Z4UX-N4JT] (last visited Apr. 2, 2020).
See U.S. Climate All., 2018 Annual Report 2 (2018), https://static1.squarespace.com/static/5a4cfbfe18b27d4da21c9361/t/5b9bda1d1ae6cf830c7f80a7/1536940617096/USCA_2018+Annual+Report_20180911-FINAL.pdf [https://perma.cc/8AYZ-3QVG]; Members, Climate Mayors, http://climatemayors.org/about/members/ [https://perma.cc/93HH-WMYM] (last visited Apr. 2, 2020); Who’s in, We Are Still In, https://www.wearestillin.com/signatories [https://perma.cc/5X6R-B3XR] (last visited Apr. 2, 2020). The “Who’s In” page on the We Are Still In website is a database from which the user can select any member and view that member’s communicated commitments. When this Note cites statistics related to the We Are Still In initiative, it refers to statistics compiled by aggregating the data in these commitments. See infra Part IV (discussing the limits on subnational climate initiatives).
Statement from the Climate Mayors in Response to President Trump’s Withdrawal from the Paris Climate Agreement, supra note 26.
See Kevin M. Stack & Michael P. Vandenbergh, The One Percent Problem, 111 Colum. L. Rev. 1385, 1402 (2011) (arguing that climate change cannot be addressed by focusing only on major sources of carbon emissions).
Carbon dioxide (CO2) is just one of several greenhouse gasses that may result in harmful warming effects. The other common greenhouse gasses are methane (CH4), nitrous oxide (N2O), and fluorinated gases (most commonly HFCs, PFCs, SF6, and NF5). See generally Overview of Greenhouse Gasses, U.S. Envtl. Protection Agency, https://www.epa.gov/ghgemissions/overview-greenhouse-gases [https://perma.cc/5MDK-Z4UC] (last updated Apr. 11, 2019); see also Ottinger et al., supra note 21, at 128–30, 135–36 (describing the relative potencies of GHGs and observing that CO2 accounts for a majority of past and future warming).
U.S. Envtl. Prot. Agency, EPA 430-R-18-003, Inventory of U.S. Greenhouse Gas Emissions and Sinks 1990–2016, at ES-6 (2018), https://www.epa.gov/sites/production/files/2018-01/documents/2018_complete_report.pdf [https://perma.cc/58HH-N3WV].
Together, these two sectors account for 72% of American carbon emissions (calendar year 2016). Id. Please note that these numbers and Figure 1, infra, refer to carbon emissions that result from burning fossil fuels. To repeat, that sum accounts for roughly 94% of all American carbon emissions. For brevity, in this Note, I say “carbon emissions” rather than the much longer “carbon emissions that result from burning fossil fuels.” I explicitly note when I refer to a different base.
Id. at 2-24. The industrial category refers to the emissions released from “industrial processes and from the use of greenhouse gases in products.” Id. at 4-1. For a more in-depth explanation, see id. at 4-1 to 4-130. (“Industrial Processes and Product Use”). Emissions from the residential and commercial sectors result mostly from the use of electricity or, to a lesser extent, petroleum or natural gas, to light, heat, or cool a building and to power appliances. Id. at ES-13.
Id. at ES-6 to ES-8 tbl.ES-2.
The data used to compile this graph come from the same table. Id.
Id. at ES-11. The statistics cited in this paragraph may be found id.
The data used to compile this graph may be found id. at 3-34 to 3-35 tbl.3-16.
The data used to compile this graph may be found id. at 3-13 tbl.3-9, 3-34 to 3-35 tbl.3-16.
Id. at 2-27 tbl.2-11.
For a discussion of the capacity of subnational policies to address other environmental problems, see Kirsten H. Engel, Democratic Environmental Experimentalism, 35 UCLA J. Envtl. L. & Pol’y 57, 62–67 (2017) (explaining the interaction of federal and subnational environmental policy); and id. at 69–71 (listing examples of successful state and local environmental initiatives).
Richard E. Ayres et al., Setting National Ambient Air Quality Standards, in The Clean Air Act Handbook 15, 28 (Julie R. Domike & Alec C. Zacaroli eds., 4th ed. 2016). Ground level ozone is a combination of volatile organic compounds (VOCs), various nitrous oxides (NOX), and sunlight. See generally Ground-Level Ozone Basics, U.S. Envtl. Protection Agency, https://www.epa.gov/ground-level-ozone-pollution/ground-level-ozone-basics [https://perma.cc/TEJ6-DWP5] (last updated Oct. 31, 2018).
See National Ambient Air Quality Standards for Ozone, 80 Fed. Reg. 65,292 (Oct. 26, 2015) (to be codified at 40 C.F.R. pts. 50–53, 58); see also Ayres et al., supra note 41, at 28–33.
See National Ambient Air Quality Standards for Ozone, 80 Fed. Reg. at 65,302–07. For a tabular summary of the health effects, see id. at 65,313 tbl.1. See generally Jesse D. Berman et al., Health Benefits from Large-Scale Ozone Reduction in the United States, 120 Envtl. Health Persp. 1404 (2012).
See Gerrard, supra note 16, at 11–12 (citing Intergovernmental Panel on Climate Change, Climate Change 2001: Synthesis Report 9 (2001), https://www.ipcc.ch/site/assets/uploads/2018/05/SYR_TAR_full_report.pdf [https://perma.cc/8RQU-4NXC]). For the Intergovernmental Panel on Climate Change’s (IPCC) most recent report, see Intergovernmental Panel on Climate Change, Climate Change 2014: Synthesis Report (2015) [hereinafter IPCC 2014], https://www.ipcc.ch/site/assets/uploads/2018/05/SYR_AR5_FINAL_full_wcover.pdf [https://perma.cc/36HN-QNT6]; see also AR6 Synthesis Report: Climate Change 2022 — IPCC, Intergovernmental Panel on Climate Change, https://www.ipcc.ch/report/sixth-assessment-report-cycle/ [https://perma.cc/U8AP-PWYF] (last visited Apr. 2, 2020) (indicating that the IPCC’s newest report will be produced in 2022).
IPCC assesses the effects of climate change according to ranges of potential temperature variations. Though some level of harm is certain, the precise amount of harm is uncertain. See IPCC 2014, supra note 44, at 64–69.
See Hinrich Schaefer, On the Causes and Consequences of Recent Trends in Atmospheric Methane, 5 Current Climate Change Rep. 259, 261–62 (2019) (explaining that methane, which has a larger impact on climate change than carbon dioxide, can be regionally concentrated).
For example, the maximum ozone concentration in the Houston-Galveston-Brazoria region has dropped from 150 parts per billion by volume (ppbv) in 1978 to 100 ppbv in 2005. TexAQ II Rapid Sci. Synthesis Team, Tex. Comm’n Envtl. Qual., Synthesis Report: Findings from the Second Texas Air Quality Study 17 (2007), https://www.tceq.texas.gov/assets/public/implementation/air/am/texaqs/rsst_final_report.pdf [https://perma.cc/4ZMA-96G9].
The sum of global carbon emissions affects the global climate. Thus, state and local policies affect their respective regions only to the extent that they are affected by the policies’ global impact. See Edmond A. Mathez & Jason E. Smerdon, Climate Change: The Science of Global Warming and Our Energy Future 142–59 (2d ed. 2018) (explaining that the global total of carbon emissions contributes to the sum of the warming effect).
See generally Louis K. Liggett Co. v. Lee, 228 U.S. 517, 557–59 (1933) (Brandeis, J., dissenting); William L. Cary, Federalism and Corporate Law: Reflections upon Delaware, 83 Yale L.J. 663 (1974).
For a summary of the collective action problem in environmental law generally, see E. Donald Elliot et al., Toward a Theory of Statutory Evolution: The Federalization of Environmental Law, in Foundations of Environmental Law and Policy 186 (Richard Revesz ed., 1997).
According to the EPA, lost value in and damage to coastal property is the third highest expected cost of climate change (note that this cost is 326% larger than the fourth largest cost (air quality)). The Midwest, which accounts for 17.70% of American carbon emissions, is not at risk of coastal damage from the rising ocean levels. See U.S. Envtl. Prot. Agency, Multi-Modal Framework for Quantitative Sectoral Impacts Analysis: A Technical Report for the Fourth National Climate Assessment 5 fig.113 (2017), https://cfpub.epa.gov/si/si_public_record_Report.cfm?Lab=OAP&dirEntryId=335095 [https://perma.cc/2LKF-8XMP]; U.S. Energy Info. Admin., Energy Related Carbon Dioxide Emissions by State, 2000–2015, at 8–9 tbl.1 (2019), https://www.eia.gov/environment/emissions/state/analysis/pdf/stateanalysis.pdf [https://perma.cc/NTM7-VB3M]. Note, however, that sometimes the incentives do match up with responsibility. According to the EPA, by 2090, America will lose $160 billion per year in lost wages because increased temperatures will force labor hours to be reduced. The EPA projects the Southeast to feel this impact disproportionately; though the Southeast accounts for only 26.07% of American emissions, the EPA projects that it will lose $47 billion annually in lost wages by 2090 (29.67% of the total annual lost wages). See U.S. Envtl. Prot. Agency, supra, at 3, 227, 228 fig.30.3; U.S. Energy Info. Admin., supra, at 8–9 tbl.1.
See Barry G. Rabe, Introduction: The Challenges of U.S. Climate Governance, in Greenhouse Governance: Addressing Climate Change in America 10–12, 11 tbl.1-1 (Barry G. Rabe ed., 2010).
See, e.g., Gerrard, supra note 16, at 3–16. Governments and international organizations also use some form of the 2ºC standard. The stated goal of the Paris Agreement, for example, is to hold “the increase in global average temperature to well below 2ºC above pre-industrial levels” and to pursue “efforts to limit the temperature increase to 1.5ºC above pre-industrial levels, recognizing that this would significantly decrease the risks and impacts of climate change.” Paris Agreement, supra note 11, art. 2, § 1(a); see also Ottinger et al., supra note 21, at 133–34 (noting the wide range of potential global temperature increase (1.5ºC to 5.5ºC)).
See Ottinger et al., supra note 21, at 138–39 (describing the potentially enormous damage costs of climate change and the uncertainty that surrounds the calculations of these costs; Henry Shue, Subsistence Emissions and Luxury Emissions, in Foundations of Environmental Law and Policy, supra note 50, at 322, 322–29 (summarizing those issues that nations should confront in the consideration of global environmental policy); Carnegie Comm’n on Sci., Tech., & Gov’t, Science, Risk, and Regulatory Decision Making, in Risk and the Environment: Improving Regulatory Decision Making 73, 73–74 (1993) (noting, in general, the difficulty of creating effective environmental policy in the context of complex and potentially ambiguous scientific data); see also supra notes 18–20 and accompanying text.
Stack & Vandenbergh, supra note 29, at 1389–90. But see Mathez & Smerdon, supra note 48, at 355–65 (explaining the mathematical uncertainty in emissions and temperature models).
For developed nations, scientists estimate that an 80% reduction by 2050 from 1990 levels is required. See Stack & Vandenbergh, supra note 29, at 1390.
See NDC Registry, supra note 17.
See id. (“This target is consistent with a straight line emission reduction pathway from 2020 to deep, economy-wide emissions reductions of 80% or more by 2050.”).
See supra notes 26–28 and accompanying text.
See Richard B. Stewart, Pyramids of Sacrifice? Problems of Federalism in Mandating State Implementation of National Environmental Policy, in Foundations of Environmental Law and Policy, supra note 50, at 163, 167; Jonathan H. Adler, Jurisdictional Mismatch in Environmental Federalism, 14 N.Y.U. Envtl. L.J. 130, 132 (2005); Henry N. Butler & Jonathan R. Macey, Externalities and the Matching Principle: The Case for Reallocating Environmental Regulatory Authority, 14 Yale L. & Pol’y Rev. 23, 34, 36–37 (1996).
See generally Arnold W. Reitze, Jr., Federal Control of Carbon Dioxide Emissions: What Are the Options?, 36 B.C. Envtl. Affs. L. Rev. 1 (2009) (discussing the various mechanisms by which the American government can regulate CO2).
See supra Figure 1.
U.S. Envtl. Prot. Agency, supra note 31, at 3-13 tbl.3-9. For reference, note that stationary coal and natural gas power plants account for 64.7% of power generation. For calendar year 2016, nuclear (19.8%), hydroelectric (7.1%), and other renewable energy sources (8.4%) are responsible for the remaining 35.3% of power generation. See Electricity Data Browser, U.S. Energy Info. Admin., https://www.eia.gov/electricity/data/browser/ [https://perma.cc/4ADA-JTME] (last visited Apr. 2, 2020) (select “Annual” tab; then scroll left to view 2016 data).
See Kyle Danish & Avi Zevin, The Clean Air Act and Global Climate Change, in The Clean Air Act Handbook, supra note 41, at 563, 578–80. Other environmental statutes regulate power plants and less directly affect the level of carbon emissions. The Clean Water Act, for example, regulates water discharges from coal mines. As the regulatory costs increase, so too does the price of coal. Profits from coal-fired power plants, in turn, decrease. This decrease in profits leads to a decrease in production and, accordingly, a drop in carbon emissions. See David B. Spence, Regulation of Coal Fired Electric Power under U.S. Law (Jan. 16, 2014) (manuscript at 5–6, 9–17), https://www.americanbar.org/content/dam/aba/administrative/environment_energy_resources/resources/spence_coal_electric.pdf [https://perma.cc/8ZJN-3FGY].
Bernard F. Hawkins, Jr. & Mary Ellen Ternes, The New Source Review Program, in The Clean Air Act Handbook, supra note 41, at 137, 154.
See id. at 155.
Angela R. Morris, Overview of the Title V Operating Permit Process, in The Clean Air Act Handbook, supra note 41, at 615, 615–16.
These laws apply to sources that collectively account for 83% of carbon emissions. See Danish & Zevin, supra note 64, at 584. The landmark decision Utility Air Regulatory Group v. E.P.A. authorized EPA to regulate carbon emissions under PSD and Title V from sources that otherwise trigger PSD thresholds. Util. Air Regulatory Grp. v. E.P.A. 134 S. Ct. 2427, 2442 (2014).
See Danish & Zevin, supra note 64, at 578.
Id. at 581.
Id.
See Robert J. Martineau, Jr. & Michael K. Stagg, New Source Performance Standards, in The Clean Air Act Handbook, supra note 41, at 329, 329–31.
40 C.F.R. pt. 60, subpt. TTTT, 806 tbl.1 (2019).
See Danish & Zevin, supra note 64, at 588. President Obama’s EPA estimated the cost of compliance with the Clean Power Plan to be in the order of $4.5–5.5 billion by 2025 or $7.3–8.8 billion by 2030. U.S. Envtl. Prot. Agency, EPA-452-R-14-002, Regulatory Impact Analysis for the Proposed Carbon Pollution Guidelines for Existing Power Plants and Emission Standards for Modified and Reconstructed Power Plants ES-7 (2014), https://www.epa.gov/sites/production/files/2014-06/documents/20140602ria-clean-power-plan.pdf [https://perma.cc/CB9X-Q683].
For a discussion of the legal basis for the Clean Power Plan, see Rick A. Waltman, Assessing the EPA’s Authority to Regulate Greenhouse Gas Emissions Under Clean Air Act Section 111(d) and the Clean Power Plan, 27 Vill. Envtl. L.J. 35, 57–58 (2016). President Trump’s EPA finalized the repeal of the Clean Power Plan in July of 2019. Repeal of the Clean Power Plan, 84 Fed. Reg. 32,520 (Jul. 8, 2019) (to be codified at 40 C.F.R. pt. 60).
Clean Air Act § 107(a), 42 U.S.C. § 7407(a) (2012); James D. Braddock & Alec C. Zacaroli, Meeting Ambient Air Standards: Development of the State Implementation Plans, in The Clean Air Act Handbook, supra note 41, at 49, 49.
Office of the Chief Fin. Officer, U.S. Envtl. Prot. Agency, EPA-190-K-17-001, FY 2018 EPA Budget in Brief 1 (2017), https://www.epa.gov/sites/production/files/2017-05/documents/fy-2018-budget-in-brief.pdf [https://perma.cc/EQV9-7ZPS]; Tex. Comm’n Envtl. Quality, SFR-057/18, FY 2017-FY 2018 Biennial Report to the 86th Legislature 45 (2018), https://www.tceq.texas.gov/assets/public/comm_exec/pubs/sfr/057_18/SFR-057-18-X.pdf [https://perma.cc/L8FU-C6GH]. Note that the EPA’s budget, already fifteen times larger than TCEQ’s, has been reduced by $2.945 billion since 2016 (a 34% reduction). See Office of the Chief Fin. Officer, U.S. Envtl. Prot. Agency, EPA-190-S-15-001, FY 2016 EPA Budget in Brief 1 (2015), https://www.epa.gov/sites/production/files/2015-02/documents/fy_2016_bib_combined_v5.pdf [https://perma.cc/QK9F-5HML].
See supra Section II.B.2. For a discussion of the economics of production shifting, see Craig N. Oren, Prevention of Significant Deterioration: Control-Compelling Versus Site-Shifting, in Foundations of Environmental Law and Policy, supra note 50, at 236, 237–38; Wayne B. Gray & Ronald J. Shadbegian, When Do Firms Shift Production Across States to Avoid Environmental Regulation? 6–8 (Nat’l Ctr. for Envtl. Econ., Working Paper No. 02-02, 2002), https://www.nber.org/papers/w8705.pdf [https://perma.cc/S3EH-FPAQ].
As of 2017, renewable energy production has grown by 60.7% since 2010 and 92.6% since 2000. However, such production accounted for only 17% of the total American energy production in 2017 (up from 10.4% in 2010 and 9.4% in 2000). See Office of Energy Stat., U.S. Energy Info. Admin., December 2018 Monthly Energy Review 125 tbl.7.2a (2019), https://www.eia.gov/totalenergy/data/monthly/archive/00351812.pdf [https://perma.cc/H652-36UM]. To compare the value-cost ratios of various forms of energy production, see Mathez & Smerdon, supra note 48, at 381 tbl.13.2.
See Laura H. Kosloff & Mark C. Trexler, Consideration of Climate Change in Facility Permitting, in Global Climate Change and U.S. Law, supra note 9, at 259, 265–67; see also Justin Gundlach, To Negotiate a Carbon Tax: A Rough Map of Interactions, Tradeoffs, and Risks, 43 Colum. J. Envtl. L. 269, 294–99 (2018) (discussing various state CO2 regulations).
See 42 U.S.C. § 7651b (2012); Michael Wara, Instrument Choice, Carbon Emissions, and Information, 4 Mich. J. Envtl. & Admin. L. 261, 273 (2015). For an in-depth debate on the efficacy of a carbon tax mechanism rather than a cap-and-trade model, see William D. Nordhaus, A Question of Balance: Weighing the Options on Global Warming Policies 23–25 (2008); Richard S.J. Tol, The Structure of the Climate Debate, 104 Energy Pol’y 431, 432 (2017).
Representatives from both parties have called for programs to promote renewable technology. E.g., Taylor Goldenstein, Houston Republican Dan Crenshaw Says Conservatives Can’t Afford to Ignore Climate Change, Hous. Chron. (Jan. 22, 2020, 7:54 PM), https://www.houstonchronicle.com/news/politics/texas/article/Houston-Republican-Dan-Crenshaw-says-14996288.php [https://perma.cc/A3F7-7MMP].
See U.S. Envtl. Prot. Agency, supra note 31, at 2-12, 3-13 tbl.3-9; supra note 63 and accompanying text.
See U.S. Envtl. Prot. Agency, supra note 31, at 2-12, 2-30.
See supra Section II.A.
40 C.F.R. §§ 60.5360–.5365 (2019).
See supra notes 78–79 and accompanying text.
See, e.g., Oil and Natural Gas Sector: Emission Standards for New, Reconstructed, and Modified Sources Review, 84 Fed. Reg. 50,244 (proposed Sept. 24, 2019).
See supra note 81.
See JJ England, Saving Preemption in the Clean Air Act: Climate Change, State Common Law, and Plaintiffs Without a Remedy, 43 Envtl. L. 701, 712–13, 721–22 (2013). The EPA has regulated GHG mobile source emissions through Title II. 2017 and Later Model Year Light-Duty Vehicle Greenhouse Gas Emissions and Corporate Average Fuel Economy Standards, 77 Fed. Reg. 62,624, 62,671 (Oct. 15, 2012) (to be codified at 40 C.F.R. pts. 85, 86, and 600).
See Clean Air Act § 202, 42 U.S.C. § 7521 (2012); Richard K. Lattanzio et al., Cong. Research Serv., R45204, Vehicle Fuel Economy and Greenhouse Gas Standards: Frequently Asked Questions 1 (2019).
See Jody Freeman, The Obama Administration’s National Auto Policy: Lessons from the “Car Deal,” 35 Harv. Envtl. L. Rev. 343, 347, 359 (2011).
See Clean Air Act §§ 202–206, 42 U.S.C. §§ 7521–7525 (2018); Energy Policy and Conservation Act, tit. III, pt. A, 42 U.S.C. § 6261 (2018).
Clean Air Act § 209(a), 42 U.S.C. § 7543 (2018).
See 42 U.S.C. § 7543(b); Lattanzio et al., supra note 91, at 4. States that wish to adopt California’s standards do not need EPA approval. See 42 U.S.C. § 7507.
42 U.S.C. § 7543(e)(2)(A)(i)–(iii).
The Safer Affordable Fuel-Efficient (SAFE) Vehicle Rule Part One: One National Program, 84 Fed. Reg. 51,310 (Sept. 27, 2019) (to be codified at 40 C.F.R. pts. 85–86, and 49 C.F.R. pts. 531, 533). See generally Coral Davenport, Trump Administration Unveils Its Plan to Relax Car Pollution Rules, N.Y. Times (Aug. 2, 2018), https://www.nytimes.com/2018/08/02/climate/trump-auto-emissions-california.html [https://perma.cc/H8FC-D3VY].
The list is as follows: California, Colorado, Connecticut, Delaware, Maine, Maryland, Massachusetts, New Jersey, New York, Oregon, Pennsylvania, Rhode Island, Vermont, and Washington. States That Have Adopted California’s Vehicle Standards Under Section 177 of the Federal Clean Air Act, Cal. Air Res. Bd., https://ww2.arb.ca.gov/sites/default/files/2019-03/177-states.pdf [https://perma.cc/P5RE-YBRF] (last updated Aug. 19, 2019).
See U.S. Energy Info. Admin., DOE/EIA-0214(2017), State Energy Consumption Estimates: 1960 Through 2016, at 11 tbl.C8 (2019), https://www.eia.gov/state/seds/sep_use/notes/use_print.pdf [https://perma.cc/UWU6-2ARF].
2017 and Later Model Year Light-Duty Vehicle Greenhouse Gas Emissions and Corporate Average Fuel Economy Standards, 77 Fed. Reg. 62,624 (Oct. 15, 2012) (to be codified at 40 C.F.R. pts. 85, 86, and 600).
See Freeman, supra note 92, at 363–64, 367.
2017 and Later Model Year Light-Duty Vehicle Greenhouse Gas Emissions and Corporate Average Fuel Economy Standards, 77 Fed. Reg. at 62,627.
Administrator Wheeler and Acting Administrator Owens signed the final rule on March 30, 2020. The final rule has not yet been published in the Federal Register. For a copy of the pre-publication final rule, see The Safer Affordable Fuel-Efficient (SAFE) Rule for Model Years 2021-2026 Passenger Cars and Light Trucks, U.S. Envtl. Prot. Agency (Mar. 30, 2020), https://www.epa.gov/sites/production/files/2020-03/documents/final-fr-safe-preamble-200330.pdf [https://perma.cc/VHH7-VX5V].
State and local governments are well placed to implement clean transportation programs. See J. Kevin Healy, Local Initiatives, in Global Climate Change and U.S. Law, supra note 9, at 421, 425; David Hodas, State Initiatives, in Global Climate Change and U.S. Law, supra note 9, at 343, 345–46, 353.
U.S. Envtl. Prot. Agency, supra note 31, at 2-12.
See id. at 2-14.
NDC Registry, supra note 17 (click on “UNITED STATES OF AMERICA FIRST NDC”; then follow “USA First NDC” hyperlink) (communicating the Obama Administration’s efforts to “reduce buildings sector emissions . . . by promulgating energy conservation standards for a broad range of appliances and equipment, as well as a building code determination for residential buildings.”).
See infra Section IV.D (discussing subnational initiatives as applied to the commercial and residential sectors).
These subnational initiatives are aided by the fact that, with the progression of technology, buildings and appliances become generally more efficient. This trend is evidenced by the drop in commercial and residential emissions from 2015 to 2016 (7.7% and 5.8% respectively). U.S. Envtl. Prot. Agency, supra note 31, at 2-11.
See supra Figure 1.
See Shelly Welton, State Dynamism, Federal Constraints: Possible Constitutional Hurdles to Cross-Border Cap-and-Trade, 27 Nat. Res. & Env’t 36, 36 (2012). The nine states are Connecticut, Delaware, Maine, Maryland, Massachusetts, New Hampshire, New York, Rhode Island, and Vermont. Elements of RGGI, Regional Greenhouse Gas Initiative, https://www.rggi.org/program-overview-and-design/elements [https://perma.cc/BPN7-3BSX] (last visited Apr. 2, 2020). See generally Eleanor Stein, Regional Initiatives to Reduce Greenhouse Gas Emissions, in Global Climate Change and U.S. Law, supra note 9, at 315, 321–26 (providing an overview of the RGGI).
See U.S. Climate All., supra note 27, at 2.
See Cities Climate Action Compendium, Climate Mayors, http://climatemayors.org/actions/climate-action-compendium/ [https://perma.cc/EQE4-QQJQ] (last visited Apr. 2 , 2020); see also Healy, supra note 104, at 430–34 (summarizing several notable local government organizations).
See generally Corporate Actions, in Global Climate Change and U.S. Law, supra note 9, at 451, 451–588 (providing a detailed discussion of business initiatives in climate policy).
See “We Are Still in” Declaration, We Are Still In, https://www.wearestillin.com/we-are-still-declaration [https://perma.cc/YYZ2-KAZF] (last visited Apr. 2, 2020).
See Census Bureau Regions and Divisions with State FIPS Codes, U.S. Census Bureau, https://www2.census.gov/geo/docs/maps-data/maps/reg_div.txt [https://perma.cc/YGD5-DQCQ] (last visited Apr. 2, 2020).
48.3% of the members of the Climate Mayors, 66.7% of the members of the U.S. Climate Alliance, and 60.1% of the businesses that joined the We Are Still In initiative are from the climate states. And 88.9% of the RGGI, but as it is a regional initiative, this large percentage is less telling. Members, supra note 27; U.S. Climate All., supra note 27, at 12; Who’s In, supra note 27; Elements of RGGI, supra note 111 (membership in the RGGI).
See Cal. Air Res. Bd., California Greenhouse Gas Emissions for 2000–2017, at 4 fig.2a, https://ww3.arb.ca.gov/cc/inventory/pubs/reports/2000_2016/ghg_inventory_trends_00-16.pdf [https://perma.cc/P9LU-PDVX]; Justin Gerdes, California Lawmakers Approve Cap-and-Trade Revenue Bill, Forbes (May 31, 2012), https://www.forbes.com/sites-justingerdes/2012/05/31/california-lawmakers-approve-cap-and-trade-revenue-bill/#61d06099262e [https://perma.cc/X3B3-2KV4].
See Spence, supra note 64, at 9–16.
See supra Sections III.A, III.B.
See Stein, supra note 111, at 316–17. Examples of the other regional organizations are the New England Governors/Eastern Canadian Premiers’ Climate Action Plan, the West Coast Governors Global Warming Initiative, and the Southwest Climate Change Initiative. Id. at 316.
See August Wilson, Linking Across Borders: Opportunities and Obstacles for a Joint Regional Greenhouse Gas Initiative–Western Climate Initiative Market, 43 Colum. J. Envtl. L. 227, 232–35 (2018) (describing the economic benefits of regional coalitions).
Data are for calendar year 2015. U.S. Energy Info. Admin., supra note 51, at 10–11.
See Mireya Navarro, Christie Pulls New Jersey from 10-State Climate Initiative, N.Y. Times (May 26, 2011), https://www.nytimes.com/2011/05/27/nyregion/christie-pulls-nj-from-greenhouse-gas-coalition.html [https://perma.cc/HKJ2-C72C]. Elements of RGGI, supra note 111.
See Stein, supra note 111, at 318 (“Regional collaboration among states has the potential to result in more consistent and predictable regulatory requirements and incentives than a state-by-state approach.”). This is certainly true, though only one comprehensive regional group exists.
See Hodas, supra note 104, at 355–59; see also Who’s In, supra note 27 (41.8% of corporations that communicated goals to We Are Still In pledged to increase their use of renewable power).
See Hodas, supra note 104.
Supra note 79 and accompanying text.
See Neil Auerbach, The Future of Clean Energy Finance, 20 N.Y.U. Envtl. L.J. 363, 366–67 (2014).
Id.
The U.S. EIA projects that in 2040 coal will account for roughly 10% (down from 15% in 2016) of energy consumption and natural gas will account for roughly 34% (up from 28% in 2016). Removing petroleum and other liquids—which we use primarily to generate energy for automobiles—these numbers change to 15% (down from 23% in 2016) and 52% (up from 43% in 2016). See U.S. Energy Info. Admin., Annual Energy Outlook 2017, at 14 (2017), https://www.eia.gov/outlooks/aeo/pdf/0383(2017).pdf [https://perma.cc/LM9E-HLZW].
U.S. Climate All., supra note 27, at 16, 22 (showing two examples of such initiatives: Delaware’s “Energy Efficiency Industrial Program” and New York’s “New Efficiency: New York” initiative).
See Cities Climate Action Compendium, supra note 113, at 6–7, 35 (showing examples like Boulder’s “Building Performance Ordinance” and Reno’s “City Energy Project”).
See supra Sections III.A, III.B.
Supra Figure 1.
See supra notes 98–99 and accompanying text.
48.6% of corporations that communicated policy goals to the We Are Still In initiative committed to reducing the climate impact of their transportation. On the “Who’s In” page, We Are Still In members have the option to submit a so-called climate action contribution, which describes their intended actions to combat climate change. To calculate the 48.6% figure, I aggregated all the available climate action compendiums. See Who’s In, supra note 27. Many members of the Climate Mayors have committed to improving the transportation within their cities. See Cities Climate Action Compendium, supra note 113, at 5, 10–11, 13–14, 42–43 (e.g., Berkeley, Columbus, Denver, and Seattle).
See Healy, supra note 104, at 425–26.
See U.S. Energy Info. Admin., Annual Energy Outlook 2018, at 109–10 (2018), https://www.eia.gov/outlooks/aeo/pdf/AEO2018.pdf [https://perma.cc/S33Z-SKSH].
Id. The number of miles travelled by airplane is projected to rise by over 100% as a result of an increase in demand for individual travel. Id.
See supra notes 96–99 and accompanying text.
Supra note 33 and accompanying text.
See supra text accompanying note 106.
See supra Section III.D; Healy, supra note 104, at 422–25.
See Cities Climate Action Compendium, supra note 113; Who’s In, supra note 27.
Supra Figure 1.
See supra note 123 and accompanying text.
See, e.g., Wallace S. Broecker & Robert Kunzig, Fixing Climate: What Past Climate Changes Reveal About the Current Threat—and How to Counter It (2008); Pope Francis, Laudato Si’: On Care for Our Common Home (2015); Eric Posner & Cass R. Sunstein, Climate Change Justice, 96 Geo. L.J. 1565 (2008); see also supra notes 18–20 and accompanying text.
See supra note 60 and accompanying text. This theory is at the very heart of the American government structure. See The Federalist No. 10 (James Madison) (noting that an effective scheme of government leaves “the local and particular [policy matters] to the State legislatures” so that the representatives might address the “local circumstances and lesser interests”).